Immigrants from Sweden vs Chickasaw Bachelor's Degree
COMPARE
Immigrants from Sweden
Chickasaw
Bachelor's Degree
Bachelor's Degree Comparison
Immigrants from Sweden
Chickasaw
47.0%
BACHELOR'S DEGREE
100.0/ 100
METRIC RATING
23rd/ 347
METRIC RANK
30.4%
BACHELOR'S DEGREE
0.0/ 100
METRIC RATING
299th/ 347
METRIC RANK
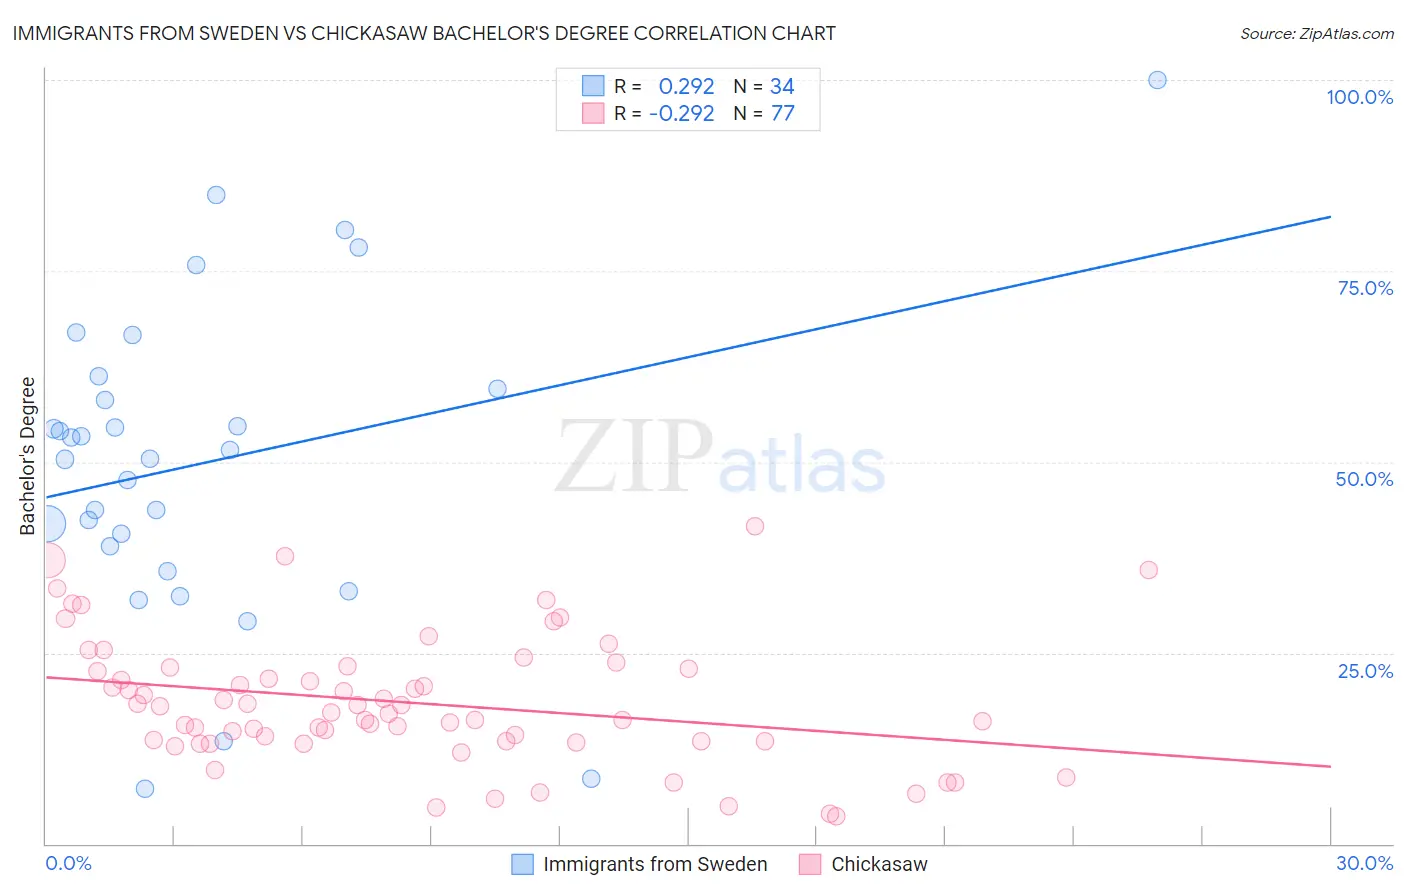
Immigrants from Sweden vs Chickasaw Bachelor's Degree Correlation Chart
The statistical analysis conducted on geographies consisting of 164,727,727 people shows a weak positive correlation between the proportion of Immigrants from Sweden and percentage of population with at least bachelor's degree education in the United States with a correlation coefficient (R) of 0.292 and weighted average of 47.0%. Similarly, the statistical analysis conducted on geographies consisting of 147,721,658 people shows a weak negative correlation between the proportion of Chickasaw and percentage of population with at least bachelor's degree education in the United States with a correlation coefficient (R) of -0.292 and weighted average of 30.4%, a difference of 54.6%.
Bachelor's Degree Correlation Summary
| Measurement | Immigrants from Sweden | Chickasaw |
| Minimum | 7.1% | 3.6% |
| Maximum | 100.0% | 41.5% |
| Range | 92.9% | 37.9% |
| Mean | 49.9% | 18.5% |
| Median | 51.0% | 17.3% |
| Interquartile 25% (IQ1) | 39.0% | 13.4% |
| Interquartile 75% (IQ3) | 59.6% | 22.9% |
| Interquartile Range (IQR) | 20.6% | 9.5% |
| Standard Deviation (Sample) | 20.5% | 8.3% |
| Standard Deviation (Population) | 20.2% | 8.3% |
Similar Demographics by Bachelor's Degree
Demographics Similar to Immigrants from Sweden by Bachelor's Degree
In terms of bachelor's degree, the demographic groups most similar to Immigrants from Sweden are Immigrants from Korea (47.0%, a difference of 0.040%), Immigrants from Belgium (47.0%, a difference of 0.090%), Burmese (46.9%, a difference of 0.26%), Immigrants from Ireland (47.1%, a difference of 0.29%), and Immigrants from Switzerland (47.1%, a difference of 0.30%).
| Demographics | Rating | Rank | Bachelor's Degree |
| Soviet Union | 100.0 /100 | #16 | Exceptional 47.9% |
| Eastern Europeans | 100.0 /100 | #17 | Exceptional 47.5% |
| Indians (Asian) | 100.0 /100 | #18 | Exceptional 47.4% |
| Cambodians | 100.0 /100 | #19 | Exceptional 47.2% |
| Immigrants | Switzerland | 100.0 /100 | #20 | Exceptional 47.1% |
| Immigrants | Ireland | 100.0 /100 | #21 | Exceptional 47.1% |
| Immigrants | Belgium | 100.0 /100 | #22 | Exceptional 47.0% |
| Immigrants | Sweden | 100.0 /100 | #23 | Exceptional 47.0% |
| Immigrants | Korea | 100.0 /100 | #24 | Exceptional 47.0% |
| Burmese | 100.0 /100 | #25 | Exceptional 46.9% |
| Immigrants | Japan | 100.0 /100 | #26 | Exceptional 46.8% |
| Immigrants | France | 100.0 /100 | #27 | Exceptional 46.4% |
| Turks | 100.0 /100 | #28 | Exceptional 46.2% |
| Israelis | 100.0 /100 | #29 | Exceptional 46.1% |
| Immigrants | Sri Lanka | 100.0 /100 | #30 | Exceptional 46.1% |
Demographics Similar to Chickasaw by Bachelor's Degree
In terms of bachelor's degree, the demographic groups most similar to Chickasaw are Immigrants from Micronesia (30.4%, a difference of 0.020%), Immigrants from Cuba (30.3%, a difference of 0.23%), Mexican American Indian (30.2%, a difference of 0.51%), Chippewa (30.6%, a difference of 0.52%), and Bangladeshi (30.2%, a difference of 0.68%).
| Demographics | Rating | Rank | Bachelor's Degree |
| Ute | 0.1 /100 | #292 | Tragic 30.9% |
| Cape Verdeans | 0.1 /100 | #293 | Tragic 30.9% |
| Immigrants | Guatemala | 0.0 /100 | #294 | Tragic 30.8% |
| Immigrants | Dominican Republic | 0.0 /100 | #295 | Tragic 30.7% |
| Puget Sound Salish | 0.0 /100 | #296 | Tragic 30.7% |
| Immigrants | Haiti | 0.0 /100 | #297 | Tragic 30.6% |
| Chippewa | 0.0 /100 | #298 | Tragic 30.6% |
| Chickasaw | 0.0 /100 | #299 | Tragic 30.4% |
| Immigrants | Micronesia | 0.0 /100 | #300 | Tragic 30.4% |
| Immigrants | Cuba | 0.0 /100 | #301 | Tragic 30.3% |
| Mexican American Indians | 0.0 /100 | #302 | Tragic 30.2% |
| Bangladeshis | 0.0 /100 | #303 | Tragic 30.2% |
| Cherokee | 0.0 /100 | #304 | Tragic 30.2% |
| Immigrants | Latin America | 0.0 /100 | #305 | Tragic 30.1% |
| Immigrants | Yemen | 0.0 /100 | #306 | Tragic 29.9% |