Immigrants from Africa vs Chickasaw 7th Grade
COMPARE
Immigrants from Africa
Chickasaw
7th Grade
7th Grade Comparison
Immigrants from Africa
Chickasaw
95.5%
7TH GRADE
2.7/ 100
METRIC RATING
235th/ 347
METRIC RANK
96.7%
7TH GRADE
99.2/ 100
METRIC RATING
82nd/ 347
METRIC RANK
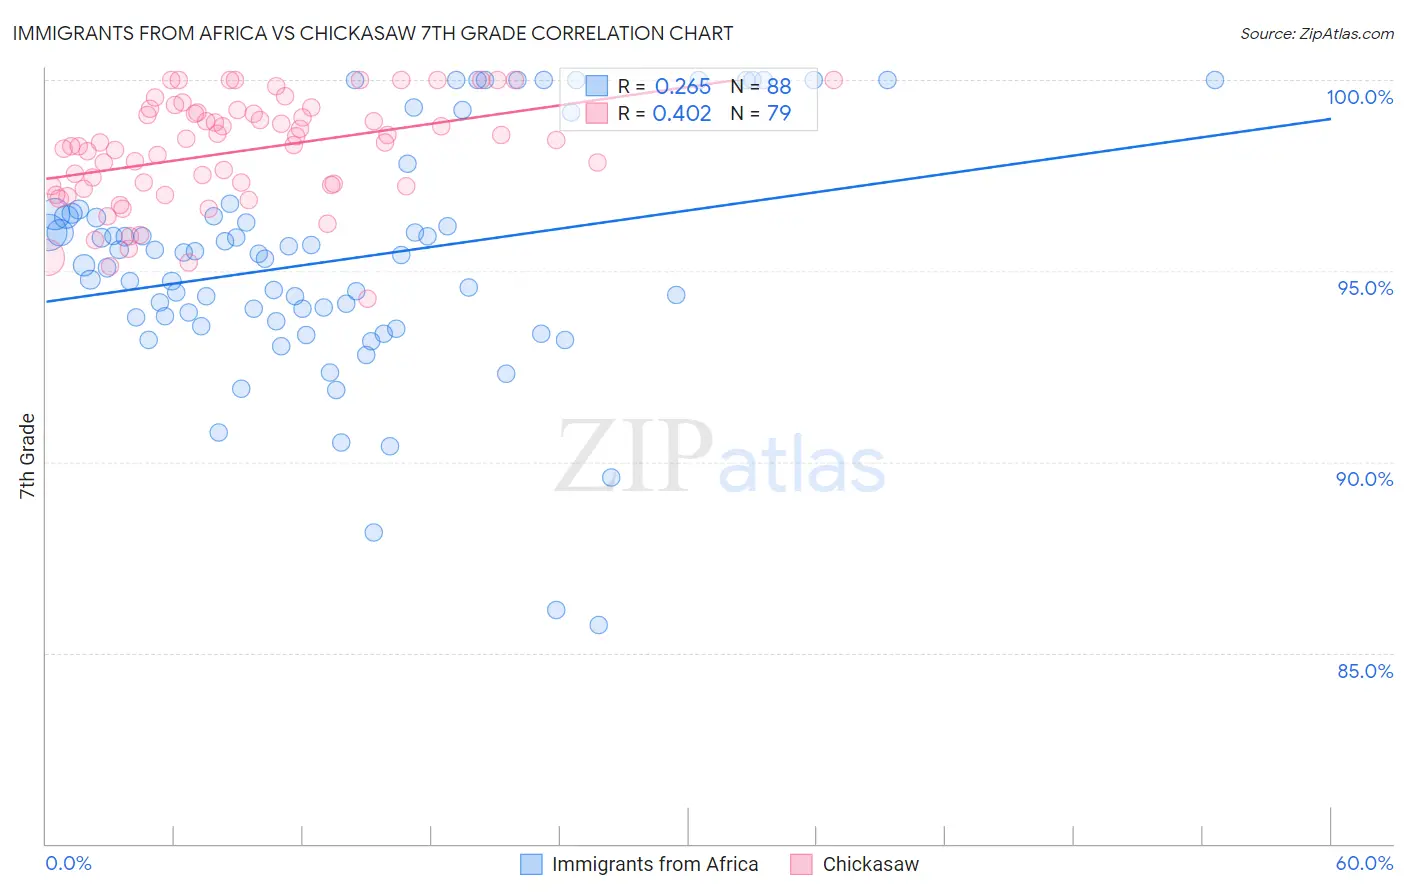
Immigrants from Africa vs Chickasaw 7th Grade Correlation Chart
The statistical analysis conducted on geographies consisting of 469,408,495 people shows a weak positive correlation between the proportion of Immigrants from Africa and percentage of population with at least 7th grade education in the United States with a correlation coefficient (R) of 0.265 and weighted average of 95.5%. Similarly, the statistical analysis conducted on geographies consisting of 147,726,545 people shows a moderate positive correlation between the proportion of Chickasaw and percentage of population with at least 7th grade education in the United States with a correlation coefficient (R) of 0.402 and weighted average of 96.7%, a difference of 1.3%.
7th Grade Correlation Summary
| Measurement | Immigrants from Africa | Chickasaw |
| Minimum | 85.7% | 94.3% |
| Maximum | 100.0% | 100.0% |
| Range | 14.3% | 5.7% |
| Mean | 95.3% | 98.1% |
| Median | 95.4% | 98.4% |
| Interquartile 25% (IQ1) | 93.7% | 97.2% |
| Interquartile 75% (IQ3) | 96.5% | 99.1% |
| Interquartile Range (IQR) | 2.7% | 1.9% |
| Standard Deviation (Sample) | 3.1% | 1.4% |
| Standard Deviation (Population) | 3.0% | 1.4% |
Similar Demographics by 7th Grade
Demographics Similar to Immigrants from Africa by 7th Grade
In terms of 7th grade, the demographic groups most similar to Immigrants from Africa are Nigerian (95.5%, a difference of 0.010%), Asian (95.5%, a difference of 0.010%), Immigrants from Asia (95.5%, a difference of 0.020%), Costa Rican (95.5%, a difference of 0.030%), and Immigrants from Indonesia (95.5%, a difference of 0.030%).
| Demographics | Rating | Rank | 7th Grade |
| Immigrants | Eastern Africa | 5.1 /100 | #228 | Tragic 95.6% |
| Immigrants | Panama | 4.9 /100 | #229 | Tragic 95.6% |
| Natives/Alaskans | 4.2 /100 | #230 | Tragic 95.6% |
| Senegalese | 4.0 /100 | #231 | Tragic 95.6% |
| Costa Ricans | 3.3 /100 | #232 | Tragic 95.5% |
| Immigrants | Indonesia | 3.3 /100 | #233 | Tragic 95.5% |
| Nigerians | 3.0 /100 | #234 | Tragic 95.5% |
| Immigrants | Africa | 2.7 /100 | #235 | Tragic 95.5% |
| Asians | 2.6 /100 | #236 | Tragic 95.5% |
| Immigrants | Asia | 2.3 /100 | #237 | Tragic 95.5% |
| Indians (Asian) | 2.3 /100 | #238 | Tragic 95.5% |
| Jamaicans | 2.2 /100 | #239 | Tragic 95.5% |
| Immigrants | Sierra Leone | 2.0 /100 | #240 | Tragic 95.5% |
| South American Indians | 2.0 /100 | #241 | Tragic 95.5% |
| Immigrants | Senegal | 1.9 /100 | #242 | Tragic 95.5% |
Demographics Similar to Chickasaw by 7th Grade
In terms of 7th grade, the demographic groups most similar to Chickasaw are Delaware (96.8%, a difference of 0.010%), Icelander (96.7%, a difference of 0.010%), Romanian (96.7%, a difference of 0.010%), Kiowa (96.7%, a difference of 0.010%), and Turkish (96.7%, a difference of 0.020%).
| Demographics | Rating | Rank | 7th Grade |
| Zimbabweans | 99.5 /100 | #75 | Exceptional 96.8% |
| Immigrants | Ireland | 99.4 /100 | #76 | Exceptional 96.8% |
| Cherokee | 99.4 /100 | #77 | Exceptional 96.8% |
| Immigrants | Netherlands | 99.3 /100 | #78 | Exceptional 96.8% |
| Cypriots | 99.3 /100 | #79 | Exceptional 96.8% |
| Yugoslavians | 99.3 /100 | #80 | Exceptional 96.8% |
| Delaware | 99.2 /100 | #81 | Exceptional 96.8% |
| Chickasaw | 99.2 /100 | #82 | Exceptional 96.7% |
| Icelanders | 99.1 /100 | #83 | Exceptional 96.7% |
| Romanians | 99.1 /100 | #84 | Exceptional 96.7% |
| Kiowa | 99.1 /100 | #85 | Exceptional 96.7% |
| Turks | 99.1 /100 | #86 | Exceptional 96.7% |
| Immigrants | Belgium | 99.0 /100 | #87 | Exceptional 96.7% |
| Puget Sound Salish | 99.0 /100 | #88 | Exceptional 96.7% |
| Cree | 99.0 /100 | #89 | Exceptional 96.7% |