Immigrants from Nicaragua vs Chickasaw 7th Grade
COMPARE
Immigrants from Nicaragua
Chickasaw
7th Grade
7th Grade Comparison
Immigrants from Nicaragua
Chickasaw
93.0%
7TH GRADE
0.0/ 100
METRIC RATING
328th/ 347
METRIC RANK
96.7%
7TH GRADE
99.2/ 100
METRIC RATING
82nd/ 347
METRIC RANK
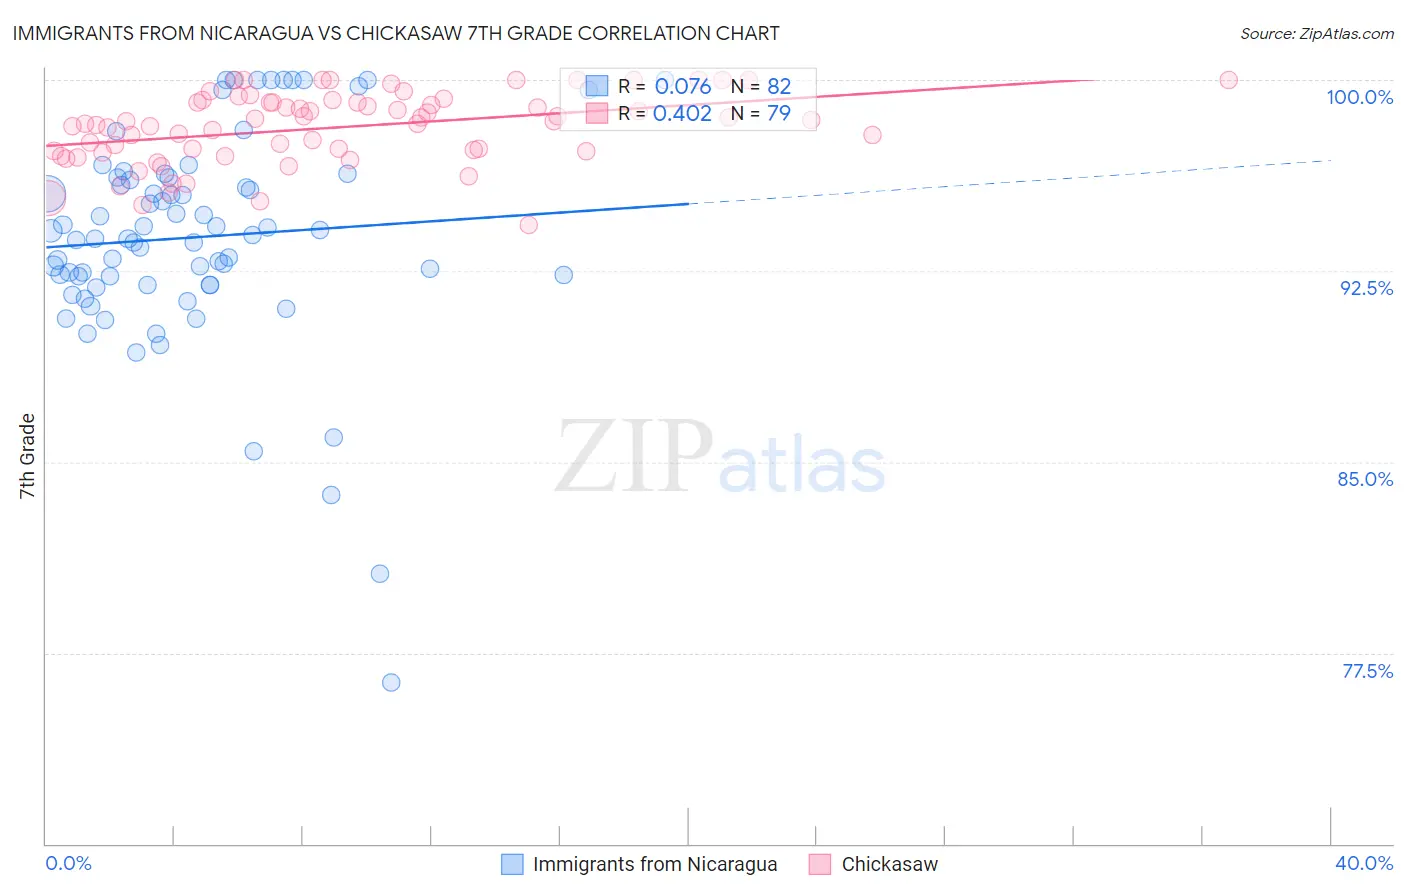
Immigrants from Nicaragua vs Chickasaw 7th Grade Correlation Chart
The statistical analysis conducted on geographies consisting of 236,340,506 people shows a slight positive correlation between the proportion of Immigrants from Nicaragua and percentage of population with at least 7th grade education in the United States with a correlation coefficient (R) of 0.076 and weighted average of 93.0%. Similarly, the statistical analysis conducted on geographies consisting of 147,726,545 people shows a moderate positive correlation between the proportion of Chickasaw and percentage of population with at least 7th grade education in the United States with a correlation coefficient (R) of 0.402 and weighted average of 96.7%, a difference of 4.0%.
7th Grade Correlation Summary
| Measurement | Immigrants from Nicaragua | Chickasaw |
| Minimum | 76.3% | 94.3% |
| Maximum | 100.0% | 100.0% |
| Range | 23.7% | 5.7% |
| Mean | 93.8% | 98.1% |
| Median | 93.8% | 98.4% |
| Interquartile 25% (IQ1) | 92.0% | 97.2% |
| Interquartile 75% (IQ3) | 96.2% | 99.1% |
| Interquartile Range (IQR) | 4.2% | 1.9% |
| Standard Deviation (Sample) | 4.2% | 1.4% |
| Standard Deviation (Population) | 4.2% | 1.4% |
Similar Demographics by 7th Grade
Demographics Similar to Immigrants from Nicaragua by 7th Grade
In terms of 7th grade, the demographic groups most similar to Immigrants from Nicaragua are Immigrants from the Azores (93.0%, a difference of 0.040%), Immigrants from Dominican Republic (92.9%, a difference of 0.090%), Immigrants from Cabo Verde (93.1%, a difference of 0.13%), Honduran (92.9%, a difference of 0.13%), and Nepalese (93.2%, a difference of 0.20%).
| Demographics | Rating | Rank | 7th Grade |
| Belizeans | 0.0 /100 | #321 | Tragic 93.5% |
| Nicaraguans | 0.0 /100 | #322 | Tragic 93.5% |
| Immigrants | Belize | 0.0 /100 | #323 | Tragic 93.4% |
| Dominicans | 0.0 /100 | #324 | Tragic 93.3% |
| Central American Indians | 0.0 /100 | #325 | Tragic 93.3% |
| Nepalese | 0.0 /100 | #326 | Tragic 93.2% |
| Immigrants | Cabo Verde | 0.0 /100 | #327 | Tragic 93.1% |
| Immigrants | Nicaragua | 0.0 /100 | #328 | Tragic 93.0% |
| Immigrants | Azores | 0.0 /100 | #329 | Tragic 93.0% |
| Immigrants | Dominican Republic | 0.0 /100 | #330 | Tragic 92.9% |
| Hondurans | 0.0 /100 | #331 | Tragic 92.9% |
| Hispanics or Latinos | 0.0 /100 | #332 | Tragic 92.7% |
| Immigrants | Armenia | 0.0 /100 | #333 | Tragic 92.7% |
| Immigrants | Yemen | 0.0 /100 | #334 | Tragic 92.6% |
| Mexican American Indians | 0.0 /100 | #335 | Tragic 92.6% |
Demographics Similar to Chickasaw by 7th Grade
In terms of 7th grade, the demographic groups most similar to Chickasaw are Delaware (96.8%, a difference of 0.010%), Icelander (96.7%, a difference of 0.010%), Romanian (96.7%, a difference of 0.010%), Kiowa (96.7%, a difference of 0.010%), and Turkish (96.7%, a difference of 0.020%).
| Demographics | Rating | Rank | 7th Grade |
| Zimbabweans | 99.5 /100 | #75 | Exceptional 96.8% |
| Immigrants | Ireland | 99.4 /100 | #76 | Exceptional 96.8% |
| Cherokee | 99.4 /100 | #77 | Exceptional 96.8% |
| Immigrants | Netherlands | 99.3 /100 | #78 | Exceptional 96.8% |
| Cypriots | 99.3 /100 | #79 | Exceptional 96.8% |
| Yugoslavians | 99.3 /100 | #80 | Exceptional 96.8% |
| Delaware | 99.2 /100 | #81 | Exceptional 96.8% |
| Chickasaw | 99.2 /100 | #82 | Exceptional 96.7% |
| Icelanders | 99.1 /100 | #83 | Exceptional 96.7% |
| Romanians | 99.1 /100 | #84 | Exceptional 96.7% |
| Kiowa | 99.1 /100 | #85 | Exceptional 96.7% |
| Turks | 99.1 /100 | #86 | Exceptional 96.7% |
| Immigrants | Belgium | 99.0 /100 | #87 | Exceptional 96.7% |
| Puget Sound Salish | 99.0 /100 | #88 | Exceptional 96.7% |
| Cree | 99.0 /100 | #89 | Exceptional 96.7% |