Immigrants from Africa vs Carpatho Rusyn 7th Grade
COMPARE
Immigrants from Africa
Carpatho Rusyn
7th Grade
7th Grade Comparison
Immigrants from Africa
Carpatho Rusyns
95.5%
7TH GRADE
2.7/ 100
METRIC RATING
235th/ 347
METRIC RANK
98.3%
7TH GRADE
100.0/ 100
METRIC RATING
3rd/ 347
METRIC RANK
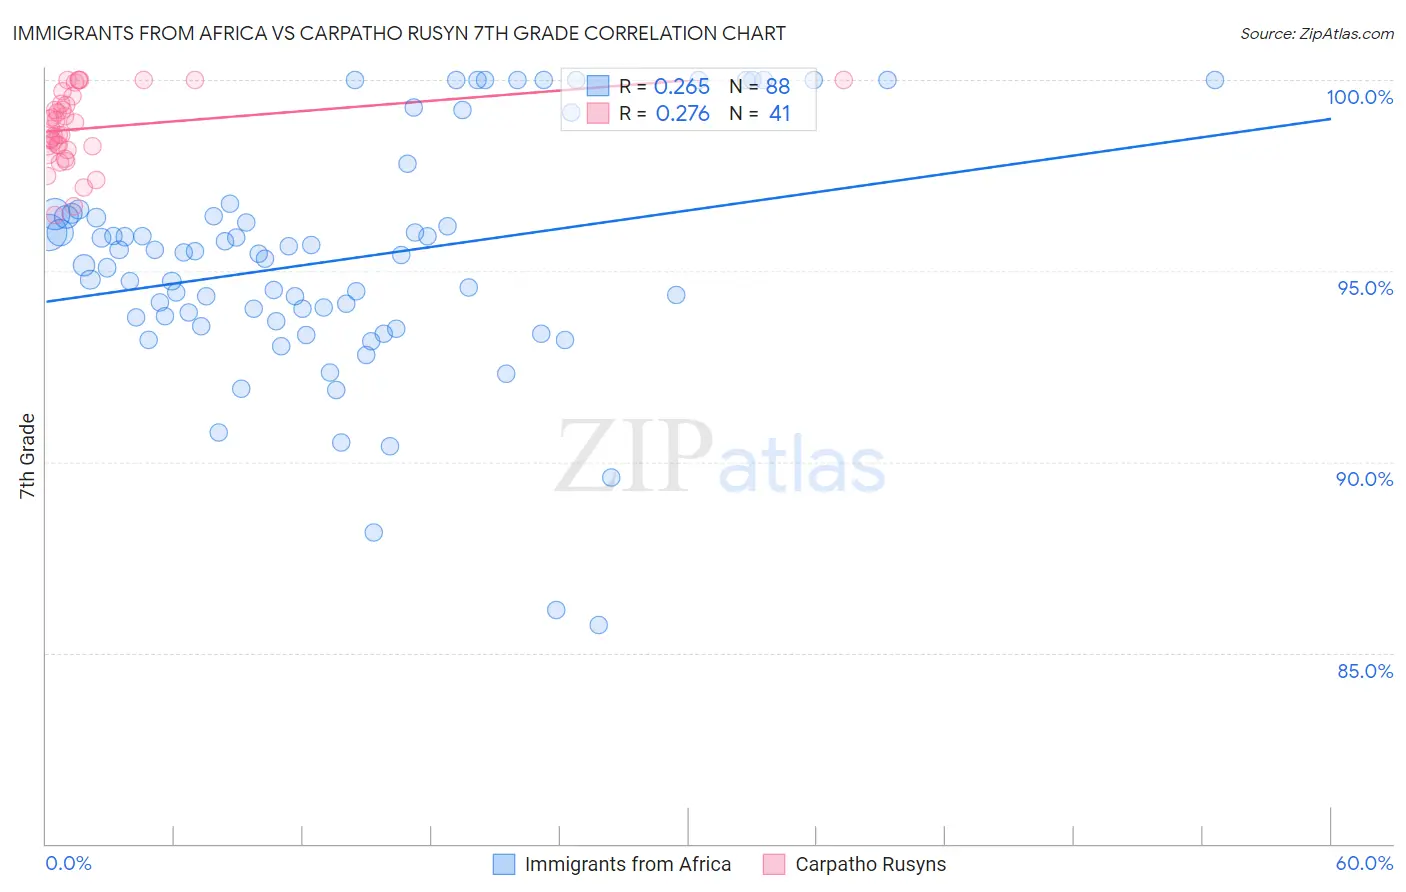
Immigrants from Africa vs Carpatho Rusyn 7th Grade Correlation Chart
The statistical analysis conducted on geographies consisting of 469,408,495 people shows a weak positive correlation between the proportion of Immigrants from Africa and percentage of population with at least 7th grade education in the United States with a correlation coefficient (R) of 0.265 and weighted average of 95.5%. Similarly, the statistical analysis conducted on geographies consisting of 10,071,463 people shows a weak positive correlation between the proportion of Carpatho Rusyns and percentage of population with at least 7th grade education in the United States with a correlation coefficient (R) of 0.276 and weighted average of 98.3%, a difference of 2.9%.
7th Grade Correlation Summary
| Measurement | Immigrants from Africa | Carpatho Rusyn |
| Minimum | 85.7% | 96.5% |
| Maximum | 100.0% | 100.0% |
| Range | 14.3% | 3.5% |
| Mean | 95.3% | 98.7% |
| Median | 95.4% | 98.7% |
| Interquartile 25% (IQ1) | 93.7% | 98.2% |
| Interquartile 75% (IQ3) | 96.5% | 99.5% |
| Interquartile Range (IQR) | 2.7% | 1.3% |
| Standard Deviation (Sample) | 3.1% | 0.94% |
| Standard Deviation (Population) | 3.0% | 0.93% |
Similar Demographics by 7th Grade
Demographics Similar to Immigrants from Africa by 7th Grade
In terms of 7th grade, the demographic groups most similar to Immigrants from Africa are Nigerian (95.5%, a difference of 0.010%), Asian (95.5%, a difference of 0.010%), Immigrants from Asia (95.5%, a difference of 0.020%), Costa Rican (95.5%, a difference of 0.030%), and Immigrants from Indonesia (95.5%, a difference of 0.030%).
| Demographics | Rating | Rank | 7th Grade |
| Immigrants | Eastern Africa | 5.1 /100 | #228 | Tragic 95.6% |
| Immigrants | Panama | 4.9 /100 | #229 | Tragic 95.6% |
| Natives/Alaskans | 4.2 /100 | #230 | Tragic 95.6% |
| Senegalese | 4.0 /100 | #231 | Tragic 95.6% |
| Costa Ricans | 3.3 /100 | #232 | Tragic 95.5% |
| Immigrants | Indonesia | 3.3 /100 | #233 | Tragic 95.5% |
| Nigerians | 3.0 /100 | #234 | Tragic 95.5% |
| Immigrants | Africa | 2.7 /100 | #235 | Tragic 95.5% |
| Asians | 2.6 /100 | #236 | Tragic 95.5% |
| Immigrants | Asia | 2.3 /100 | #237 | Tragic 95.5% |
| Indians (Asian) | 2.3 /100 | #238 | Tragic 95.5% |
| Jamaicans | 2.2 /100 | #239 | Tragic 95.5% |
| Immigrants | Sierra Leone | 2.0 /100 | #240 | Tragic 95.5% |
| South American Indians | 2.0 /100 | #241 | Tragic 95.5% |
| Immigrants | Senegal | 1.9 /100 | #242 | Tragic 95.5% |
Demographics Similar to Carpatho Rusyns by 7th Grade
In terms of 7th grade, the demographic groups most similar to Carpatho Rusyns are Finnish (98.5%, a difference of 0.18%), Ottawa (98.1%, a difference of 0.20%), Dutch (97.9%, a difference of 0.46%), Tsimshian (97.8%, a difference of 0.53%), and Norwegian (97.8%, a difference of 0.56%).
| Demographics | Rating | Rank | 7th Grade |
| Crow | 100.0 /100 | #1 | Exceptional 99.1% |
| Finns | 100.0 /100 | #2 | Exceptional 98.5% |
| Carpatho Rusyns | 100.0 /100 | #3 | Exceptional 98.3% |
| Ottawa | 100.0 /100 | #4 | Exceptional 98.1% |
| Dutch | 100.0 /100 | #5 | Exceptional 97.9% |
| Tsimshian | 100.0 /100 | #6 | Exceptional 97.8% |
| Norwegians | 100.0 /100 | #7 | Exceptional 97.8% |
| Slovaks | 100.0 /100 | #8 | Exceptional 97.8% |
| Germans | 100.0 /100 | #9 | Exceptional 97.7% |
| Slovenes | 100.0 /100 | #10 | Exceptional 97.6% |
| Alaskan Athabascans | 100.0 /100 | #11 | Exceptional 97.6% |
| Poles | 100.0 /100 | #12 | Exceptional 97.6% |
| Swedes | 100.0 /100 | #13 | Exceptional 97.6% |
| Pennsylvania Germans | 100.0 /100 | #14 | Exceptional 97.6% |
| English | 100.0 /100 | #15 | Exceptional 97.6% |