Immigrants from Afghanistan vs Tongan Professional Degree
COMPARE
Immigrants from Afghanistan
Tongan
Professional Degree
Professional Degree Comparison
Immigrants from Afghanistan
Tongans
4.5%
PROFESSIONAL DEGREE
59.2/ 100
METRIC RATING
167th/ 347
METRIC RANK
3.7%
PROFESSIONAL DEGREE
1.3/ 100
METRIC RATING
254th/ 347
METRIC RANK
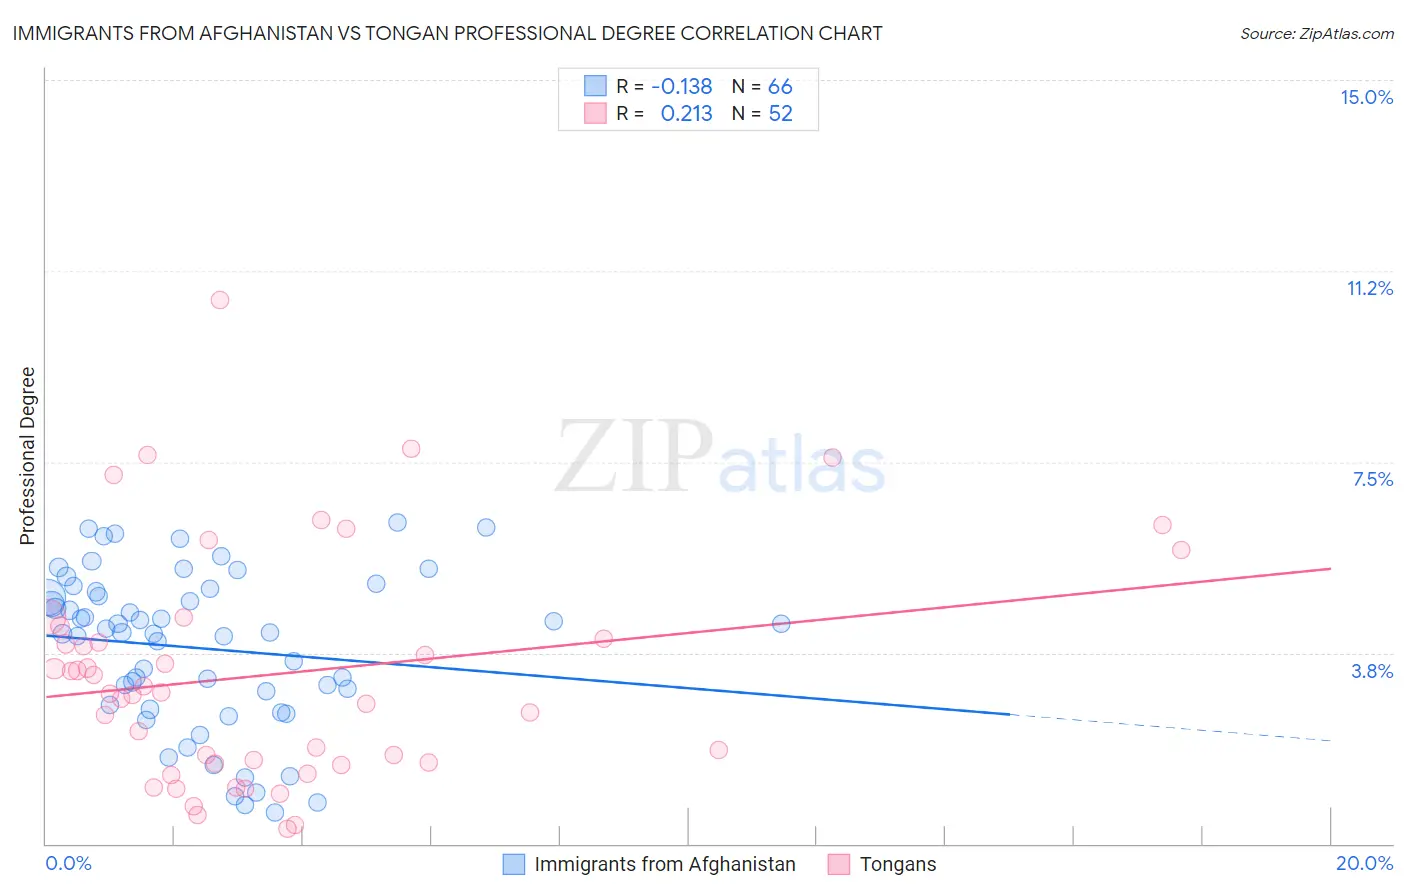
Immigrants from Afghanistan vs Tongan Professional Degree Correlation Chart
The statistical analysis conducted on geographies consisting of 147,614,795 people shows a poor negative correlation between the proportion of Immigrants from Afghanistan and percentage of population with at least professional degree education in the United States with a correlation coefficient (R) of -0.138 and weighted average of 4.5%. Similarly, the statistical analysis conducted on geographies consisting of 102,718,733 people shows a weak positive correlation between the proportion of Tongans and percentage of population with at least professional degree education in the United States with a correlation coefficient (R) of 0.213 and weighted average of 3.7%, a difference of 20.2%.
Professional Degree Correlation Summary
| Measurement | Immigrants from Afghanistan | Tongan |
| Minimum | 0.62% | 0.30% |
| Maximum | 6.3% | 10.7% |
| Range | 5.7% | 10.4% |
| Mean | 3.8% | 3.3% |
| Median | 4.1% | 3.0% |
| Interquartile 25% (IQ1) | 2.7% | 1.6% |
| Interquartile 75% (IQ3) | 5.0% | 4.2% |
| Interquartile Range (IQR) | 2.2% | 2.6% |
| Standard Deviation (Sample) | 1.5% | 2.3% |
| Standard Deviation (Population) | 1.5% | 2.2% |
Similar Demographics by Professional Degree
Demographics Similar to Immigrants from Afghanistan by Professional Degree
In terms of professional degree, the demographic groups most similar to Immigrants from Afghanistan are Immigrants from Colombia (4.5%, a difference of 0.030%), Immigrants from Sierra Leone (4.5%, a difference of 0.070%), Chinese (4.5%, a difference of 0.080%), Costa Rican (4.5%, a difference of 0.11%), and Immigrants from Zaire (4.5%, a difference of 0.26%).
| Demographics | Rating | Rank | Professional Degree |
| Immigrants | Senegal | 68.0 /100 | #160 | Good 4.5% |
| Assyrians/Chaldeans/Syriacs | 67.4 /100 | #161 | Good 4.5% |
| Peruvians | 65.2 /100 | #162 | Good 4.5% |
| Sierra Leoneans | 64.3 /100 | #163 | Good 4.5% |
| Swiss | 61.0 /100 | #164 | Good 4.5% |
| Costa Ricans | 59.9 /100 | #165 | Average 4.5% |
| Immigrants | Colombia | 59.4 /100 | #166 | Average 4.5% |
| Immigrants | Afghanistan | 59.2 /100 | #167 | Average 4.5% |
| Immigrants | Sierra Leone | 58.7 /100 | #168 | Average 4.5% |
| Chinese | 58.6 /100 | #169 | Average 4.5% |
| Immigrants | Zaire | 57.4 /100 | #170 | Average 4.5% |
| Immigrants | Bangladesh | 56.0 /100 | #171 | Average 4.4% |
| Spaniards | 52.0 /100 | #172 | Average 4.4% |
| English | 50.1 /100 | #173 | Average 4.4% |
| Kenyans | 50.0 /100 | #174 | Average 4.4% |
Demographics Similar to Tongans by Professional Degree
In terms of professional degree, the demographic groups most similar to Tongans are Pueblo (3.7%, a difference of 0.14%), Jamaican (3.7%, a difference of 0.24%), Immigrants from Nicaragua (3.7%, a difference of 0.39%), Osage (3.7%, a difference of 0.43%), and Iroquois (3.7%, a difference of 0.53%).
| Demographics | Rating | Rank | Professional Degree |
| Guyanese | 1.6 /100 | #247 | Tragic 3.8% |
| Hmong | 1.6 /100 | #248 | Tragic 3.7% |
| Immigrants | Grenada | 1.5 /100 | #249 | Tragic 3.7% |
| Immigrants | Fiji | 1.5 /100 | #250 | Tragic 3.7% |
| Immigrants | Nicaragua | 1.4 /100 | #251 | Tragic 3.7% |
| Jamaicans | 1.4 /100 | #252 | Tragic 3.7% |
| Pueblo | 1.4 /100 | #253 | Tragic 3.7% |
| Tongans | 1.3 /100 | #254 | Tragic 3.7% |
| Osage | 1.2 /100 | #255 | Tragic 3.7% |
| Iroquois | 1.2 /100 | #256 | Tragic 3.7% |
| Bahamians | 1.1 /100 | #257 | Tragic 3.7% |
| Immigrants | St. Vincent and the Grenadines | 1.1 /100 | #258 | Tragic 3.7% |
| Africans | 1.0 /100 | #259 | Tragic 3.7% |
| Indonesians | 1.0 /100 | #260 | Tragic 3.7% |
| Immigrants | Guyana | 1.0 /100 | #261 | Tragic 3.7% |