Immigrants from Serbia vs Tongan Professional Degree
COMPARE
Immigrants from Serbia
Tongan
Professional Degree
Professional Degree Comparison
Immigrants from Serbia
Tongans
5.8%
PROFESSIONAL DEGREE
100.0/ 100
METRIC RATING
52nd/ 347
METRIC RANK
3.7%
PROFESSIONAL DEGREE
1.3/ 100
METRIC RATING
254th/ 347
METRIC RANK
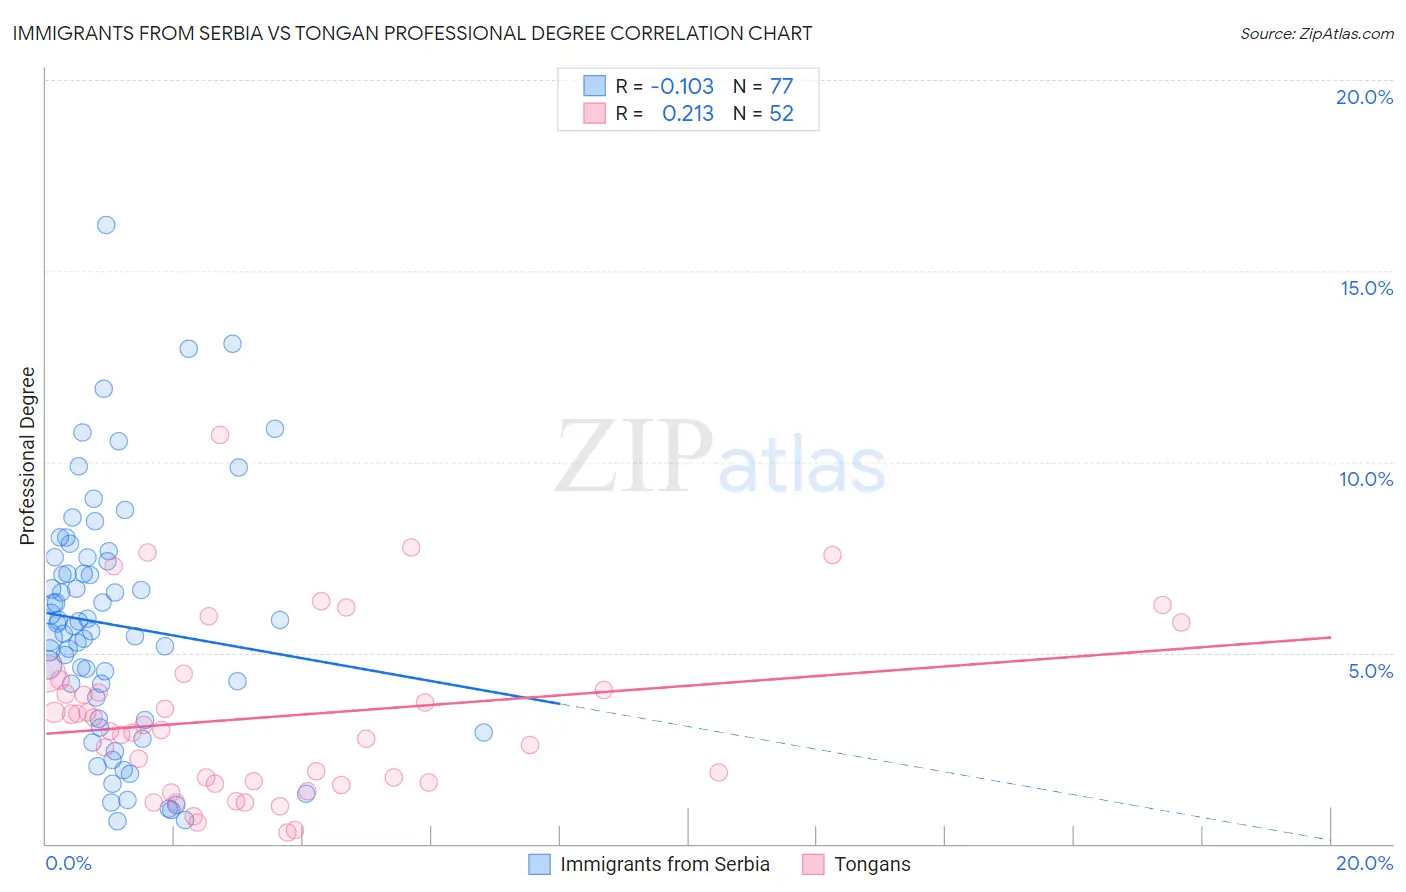
Immigrants from Serbia vs Tongan Professional Degree Correlation Chart
The statistical analysis conducted on geographies consisting of 131,711,422 people shows a poor negative correlation between the proportion of Immigrants from Serbia and percentage of population with at least professional degree education in the United States with a correlation coefficient (R) of -0.103 and weighted average of 5.8%. Similarly, the statistical analysis conducted on geographies consisting of 102,718,733 people shows a weak positive correlation between the proportion of Tongans and percentage of population with at least professional degree education in the United States with a correlation coefficient (R) of 0.213 and weighted average of 3.7%, a difference of 56.5%.
Professional Degree Correlation Summary
| Measurement | Immigrants from Serbia | Tongan |
| Minimum | 0.58% | 0.30% |
| Maximum | 16.2% | 10.7% |
| Range | 15.6% | 10.4% |
| Mean | 5.7% | 3.3% |
| Median | 5.7% | 3.0% |
| Interquartile 25% (IQ1) | 3.3% | 1.6% |
| Interquartile 75% (IQ3) | 7.5% | 4.2% |
| Interquartile Range (IQR) | 4.2% | 2.6% |
| Standard Deviation (Sample) | 3.2% | 2.3% |
| Standard Deviation (Population) | 3.2% | 2.2% |
Similar Demographics by Professional Degree
Demographics Similar to Immigrants from Serbia by Professional Degree
In terms of professional degree, the demographic groups most similar to Immigrants from Serbia are Immigrants from Greece (5.8%, a difference of 0.070%), Immigrants from Czechoslovakia (5.8%, a difference of 0.13%), Immigrants from Netherlands (5.8%, a difference of 0.23%), Immigrants from Latvia (5.8%, a difference of 0.45%), and Paraguayan (5.9%, a difference of 0.86%).
| Demographics | Rating | Rank | Professional Degree |
| Immigrants | South Central Asia | 100.0 /100 | #45 | Exceptional 5.9% |
| Immigrants | Argentina | 100.0 /100 | #46 | Exceptional 5.9% |
| Australians | 100.0 /100 | #47 | Exceptional 5.9% |
| Paraguayans | 100.0 /100 | #48 | Exceptional 5.9% |
| Immigrants | Latvia | 100.0 /100 | #49 | Exceptional 5.8% |
| Immigrants | Czechoslovakia | 100.0 /100 | #50 | Exceptional 5.8% |
| Immigrants | Greece | 100.0 /100 | #51 | Exceptional 5.8% |
| Immigrants | Serbia | 100.0 /100 | #52 | Exceptional 5.8% |
| Immigrants | Netherlands | 100.0 /100 | #53 | Exceptional 5.8% |
| Immigrants | Kuwait | 100.0 /100 | #54 | Exceptional 5.7% |
| Immigrants | Western Europe | 100.0 /100 | #55 | Exceptional 5.7% |
| Immigrants | Malaysia | 100.0 /100 | #56 | Exceptional 5.7% |
| South Africans | 100.0 /100 | #57 | Exceptional 5.7% |
| Bulgarians | 100.0 /100 | #58 | Exceptional 5.7% |
| Immigrants | Europe | 100.0 /100 | #59 | Exceptional 5.6% |
Demographics Similar to Tongans by Professional Degree
In terms of professional degree, the demographic groups most similar to Tongans are Pueblo (3.7%, a difference of 0.14%), Jamaican (3.7%, a difference of 0.24%), Immigrants from Nicaragua (3.7%, a difference of 0.39%), Osage (3.7%, a difference of 0.43%), and Iroquois (3.7%, a difference of 0.53%).
| Demographics | Rating | Rank | Professional Degree |
| Guyanese | 1.6 /100 | #247 | Tragic 3.8% |
| Hmong | 1.6 /100 | #248 | Tragic 3.7% |
| Immigrants | Grenada | 1.5 /100 | #249 | Tragic 3.7% |
| Immigrants | Fiji | 1.5 /100 | #250 | Tragic 3.7% |
| Immigrants | Nicaragua | 1.4 /100 | #251 | Tragic 3.7% |
| Jamaicans | 1.4 /100 | #252 | Tragic 3.7% |
| Pueblo | 1.4 /100 | #253 | Tragic 3.7% |
| Tongans | 1.3 /100 | #254 | Tragic 3.7% |
| Osage | 1.2 /100 | #255 | Tragic 3.7% |
| Iroquois | 1.2 /100 | #256 | Tragic 3.7% |
| Bahamians | 1.1 /100 | #257 | Tragic 3.7% |
| Immigrants | St. Vincent and the Grenadines | 1.1 /100 | #258 | Tragic 3.7% |
| Africans | 1.0 /100 | #259 | Tragic 3.7% |
| Indonesians | 1.0 /100 | #260 | Tragic 3.7% |
| Immigrants | Guyana | 1.0 /100 | #261 | Tragic 3.7% |