Immigrants from Afghanistan vs Tongan Family Households with Children
COMPARE
Immigrants from Afghanistan
Tongan
Family Households with Children
Family Households with Children Comparison
Immigrants from Afghanistan
Tongans
30.0%
FAMILY HOUSEHOLDS WITH CHILDREN
100.0/ 100
METRIC RATING
16th/ 347
METRIC RANK
31.2%
FAMILY HOUSEHOLDS WITH CHILDREN
100.0/ 100
METRIC RATING
5th/ 347
METRIC RANK
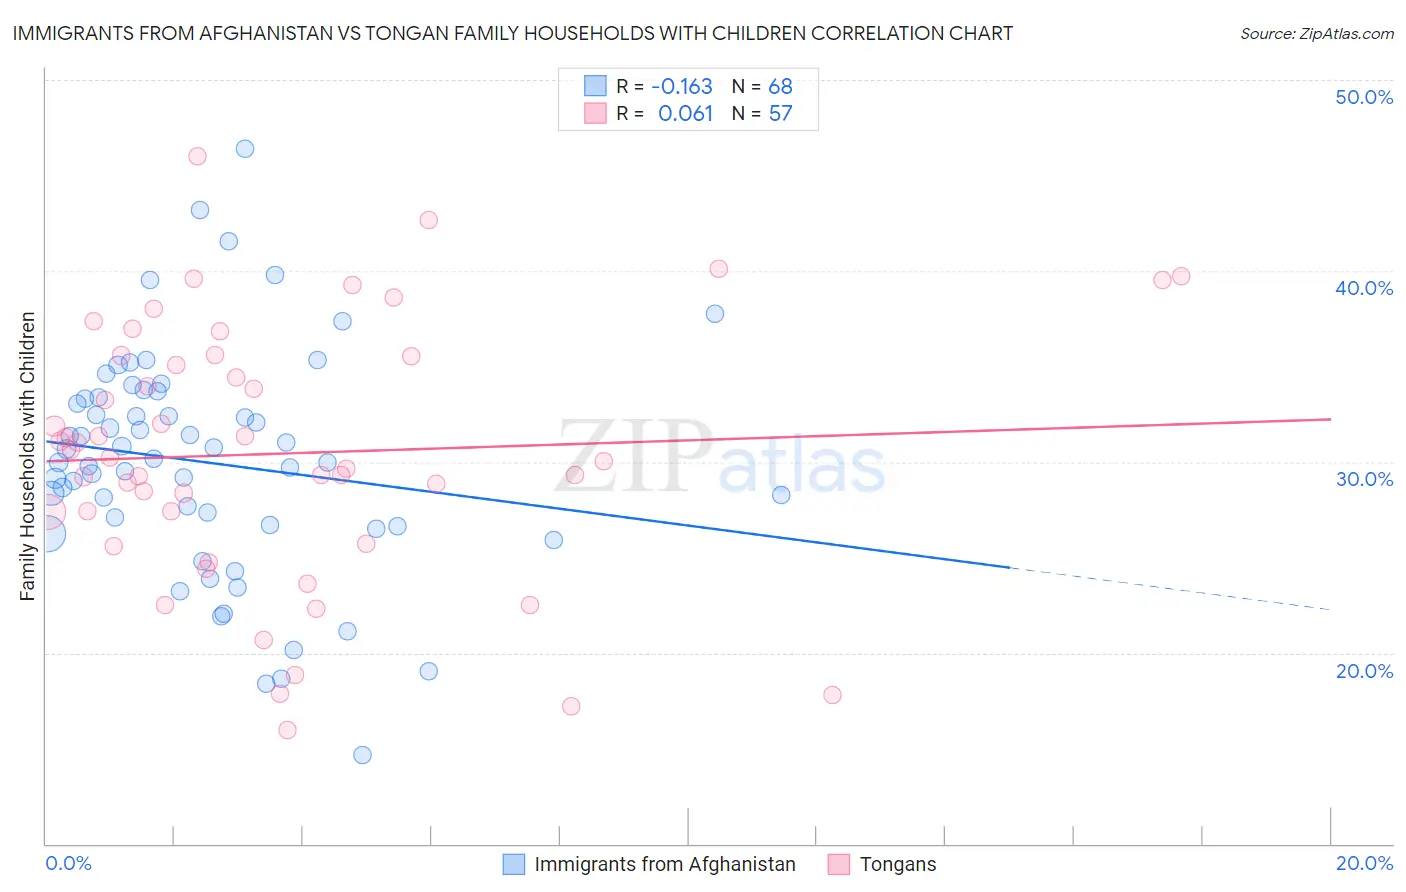
Immigrants from Afghanistan vs Tongan Family Households with Children Correlation Chart
The statistical analysis conducted on geographies consisting of 147,603,261 people shows a poor negative correlation between the proportion of Immigrants from Afghanistan and percentage of family households with children in the United States with a correlation coefficient (R) of -0.163 and weighted average of 30.0%. Similarly, the statistical analysis conducted on geographies consisting of 102,857,266 people shows a slight positive correlation between the proportion of Tongans and percentage of family households with children in the United States with a correlation coefficient (R) of 0.061 and weighted average of 31.2%, a difference of 4.0%.
Family Households with Children Correlation Summary
| Measurement | Immigrants from Afghanistan | Tongan |
| Minimum | 14.7% | 15.9% |
| Maximum | 46.4% | 46.0% |
| Range | 31.7% | 30.1% |
| Mean | 30.0% | 30.4% |
| Median | 30.1% | 30.2% |
| Interquartile 25% (IQ1) | 26.6% | 26.6% |
| Interquartile 75% (IQ3) | 33.3% | 35.5% |
| Interquartile Range (IQR) | 6.7% | 9.0% |
| Standard Deviation (Sample) | 5.9% | 6.8% |
| Standard Deviation (Population) | 5.9% | 6.7% |
Demographics Similar to Immigrants from Afghanistan and Tongans by Family Households with Children
In terms of family households with children, the demographic groups most similar to Immigrants from Afghanistan are Immigrants from South Central Asia (30.0%, a difference of 0.020%), Bangladeshi (30.1%, a difference of 0.20%), Hispanic or Latino (29.9%, a difference of 0.39%), Afghan (30.2%, a difference of 0.48%), and Salvadoran (29.9%, a difference of 0.57%). Similarly, the demographic groups most similar to Tongans are Mexican (31.4%, a difference of 0.41%), Immigrants from India (31.0%, a difference of 0.62%), Immigrants from Central America (31.0%, a difference of 0.91%), Immigrants from Mexico (31.6%, a difference of 1.2%), and Yakama (30.8%, a difference of 1.5%).
| Demographics | Rating | Rank | Family Households with Children |
| Yup'ik | 100 /100 | #1 | Exceptional 37.0% |
| Inupiat | 100 /100 | #2 | Exceptional 32.8% |
| Immigrants | Mexico | 100.0 /100 | #3 | Exceptional 31.6% |
| Mexicans | 100.0 /100 | #4 | Exceptional 31.4% |
| Tongans | 100.0 /100 | #5 | Exceptional 31.2% |
| Immigrants | India | 100.0 /100 | #6 | Exceptional 31.0% |
| Immigrants | Central America | 100.0 /100 | #7 | Exceptional 31.0% |
| Yakama | 100.0 /100 | #8 | Exceptional 30.8% |
| Thais | 100.0 /100 | #9 | Exceptional 30.6% |
| Immigrants | Fiji | 100.0 /100 | #10 | Exceptional 30.5% |
| Nepalese | 100.0 /100 | #11 | Exceptional 30.5% |
| Immigrants | Pakistan | 100.0 /100 | #12 | Exceptional 30.2% |
| Afghans | 100.0 /100 | #13 | Exceptional 30.2% |
| Bangladeshis | 100.0 /100 | #14 | Exceptional 30.1% |
| Immigrants | South Central Asia | 100.0 /100 | #15 | Exceptional 30.0% |
| Immigrants | Afghanistan | 100.0 /100 | #16 | Exceptional 30.0% |
| Hispanics or Latinos | 100.0 /100 | #17 | Exceptional 29.9% |
| Salvadorans | 100.0 /100 | #18 | Exceptional 29.9% |
| Alaska Natives | 100.0 /100 | #19 | Exceptional 29.9% |
| Immigrants | El Salvador | 100.0 /100 | #20 | Exceptional 29.8% |