Immigrants from Afghanistan vs Immigrants from Cameroon Professional Degree
COMPARE
Immigrants from Afghanistan
Immigrants from Cameroon
Professional Degree
Professional Degree Comparison
Immigrants from Afghanistan
Immigrants from Cameroon
4.5%
PROFESSIONAL DEGREE
59.2/ 100
METRIC RATING
167th/ 347
METRIC RANK
4.3%
PROFESSIONAL DEGREE
33.3/ 100
METRIC RATING
187th/ 347
METRIC RANK
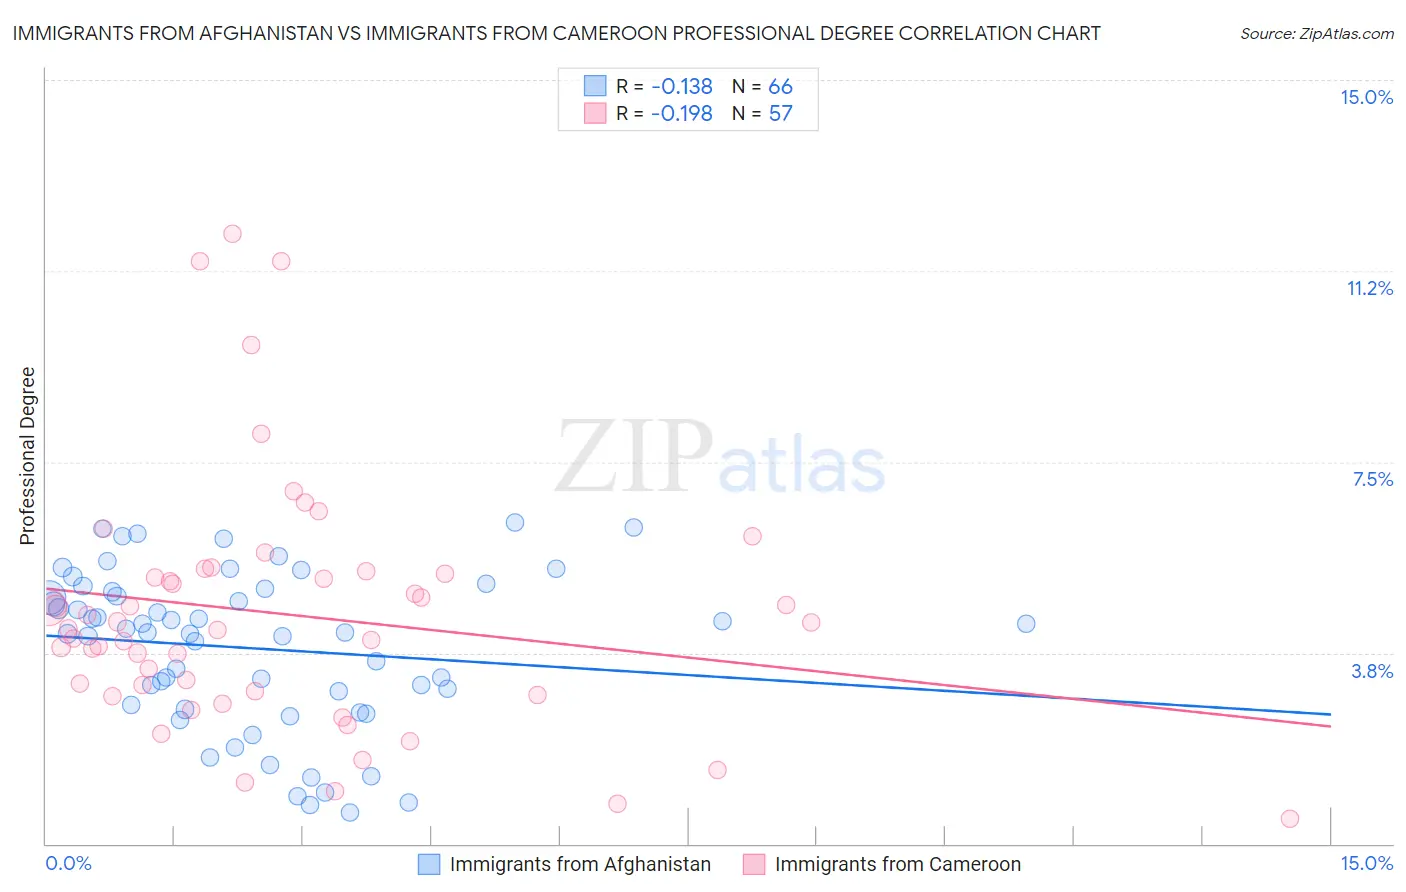
Immigrants from Afghanistan vs Immigrants from Cameroon Professional Degree Correlation Chart
The statistical analysis conducted on geographies consisting of 147,614,795 people shows a poor negative correlation between the proportion of Immigrants from Afghanistan and percentage of population with at least professional degree education in the United States with a correlation coefficient (R) of -0.138 and weighted average of 4.5%. Similarly, the statistical analysis conducted on geographies consisting of 130,670,643 people shows a poor negative correlation between the proportion of Immigrants from Cameroon and percentage of population with at least professional degree education in the United States with a correlation coefficient (R) of -0.198 and weighted average of 4.3%, a difference of 4.0%.
Professional Degree Correlation Summary
| Measurement | Immigrants from Afghanistan | Immigrants from Cameroon |
| Minimum | 0.62% | 0.49% |
| Maximum | 6.3% | 12.0% |
| Range | 5.7% | 11.5% |
| Mean | 3.8% | 4.5% |
| Median | 4.1% | 4.2% |
| Interquartile 25% (IQ1) | 2.7% | 3.0% |
| Interquartile 75% (IQ3) | 5.0% | 5.3% |
| Interquartile Range (IQR) | 2.2% | 2.4% |
| Standard Deviation (Sample) | 1.5% | 2.4% |
| Standard Deviation (Population) | 1.5% | 2.4% |
Demographics Similar to Immigrants from Afghanistan and Immigrants from Cameroon by Professional Degree
In terms of professional degree, the demographic groups most similar to Immigrants from Afghanistan are Immigrants from Sierra Leone (4.5%, a difference of 0.070%), Chinese (4.5%, a difference of 0.080%), Immigrants from Zaire (4.5%, a difference of 0.26%), Immigrants from Bangladesh (4.4%, a difference of 0.48%), and Spaniard (4.4%, a difference of 1.1%). Similarly, the demographic groups most similar to Immigrants from Cameroon are Scotch-Irish (4.3%, a difference of 0.15%), Welsh (4.3%, a difference of 0.42%), Belgian (4.3%, a difference of 0.47%), Bermudan (4.4%, a difference of 1.5%), and Immigrants (4.4%, a difference of 1.6%).
| Demographics | Rating | Rank | Professional Degree |
| Immigrants | Afghanistan | 59.2 /100 | #167 | Average 4.5% |
| Immigrants | Sierra Leone | 58.7 /100 | #168 | Average 4.5% |
| Chinese | 58.6 /100 | #169 | Average 4.5% |
| Immigrants | Zaire | 57.4 /100 | #170 | Average 4.5% |
| Immigrants | Bangladesh | 56.0 /100 | #171 | Average 4.4% |
| Spaniards | 52.0 /100 | #172 | Average 4.4% |
| English | 50.1 /100 | #173 | Average 4.4% |
| Kenyans | 50.0 /100 | #174 | Average 4.4% |
| Irish | 50.0 /100 | #175 | Average 4.4% |
| Immigrants | Peru | 49.3 /100 | #176 | Average 4.4% |
| Celtics | 47.6 /100 | #177 | Average 4.4% |
| Immigrants | Costa Rica | 46.7 /100 | #178 | Average 4.4% |
| Immigrants | Kenya | 45.9 /100 | #179 | Average 4.4% |
| Czechs | 44.9 /100 | #180 | Average 4.4% |
| Danes | 43.5 /100 | #181 | Average 4.4% |
| Immigrants | Immigrants | 43.2 /100 | #182 | Average 4.4% |
| Bermudans | 43.1 /100 | #183 | Average 4.4% |
| Belgians | 36.2 /100 | #184 | Fair 4.3% |
| Welsh | 35.8 /100 | #185 | Fair 4.3% |
| Scotch-Irish | 34.2 /100 | #186 | Fair 4.3% |
| Immigrants | Cameroon | 33.3 /100 | #187 | Fair 4.3% |