Immigrants from Cambodia vs Tongan Professional Degree
COMPARE
Immigrants from Cambodia
Tongan
Professional Degree
Professional Degree Comparison
Immigrants from Cambodia
Tongans
3.6%
PROFESSIONAL DEGREE
0.9/ 100
METRIC RATING
264th/ 347
METRIC RANK
3.7%
PROFESSIONAL DEGREE
1.3/ 100
METRIC RATING
254th/ 347
METRIC RANK
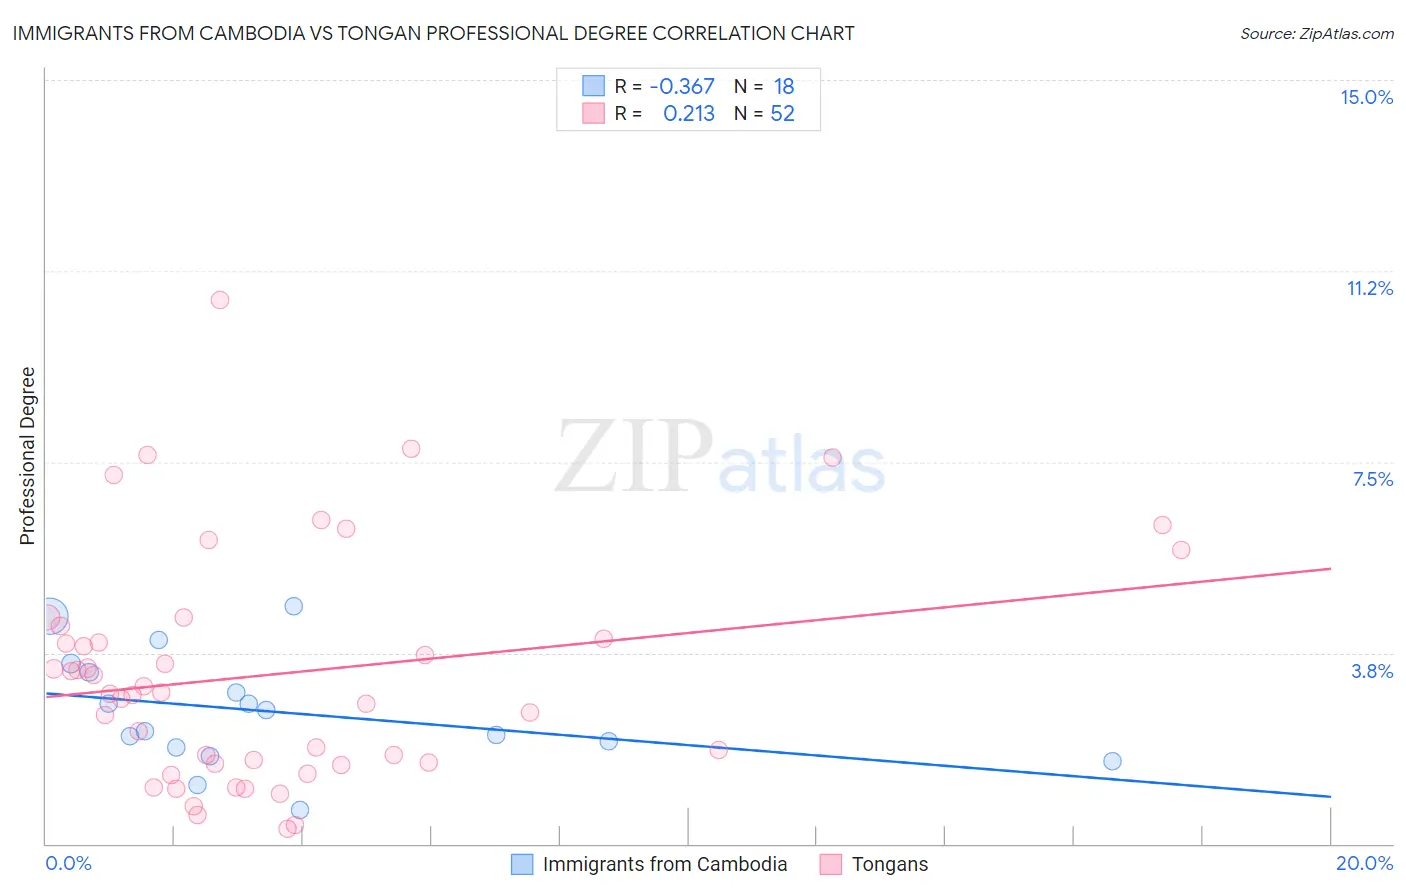
Immigrants from Cambodia vs Tongan Professional Degree Correlation Chart
The statistical analysis conducted on geographies consisting of 205,005,692 people shows a mild negative correlation between the proportion of Immigrants from Cambodia and percentage of population with at least professional degree education in the United States with a correlation coefficient (R) of -0.367 and weighted average of 3.6%. Similarly, the statistical analysis conducted on geographies consisting of 102,718,733 people shows a weak positive correlation between the proportion of Tongans and percentage of population with at least professional degree education in the United States with a correlation coefficient (R) of 0.213 and weighted average of 3.7%, a difference of 1.9%.
Professional Degree Correlation Summary
| Measurement | Immigrants from Cambodia | Tongan |
| Minimum | 0.67% | 0.30% |
| Maximum | 4.7% | 10.7% |
| Range | 4.0% | 10.4% |
| Mean | 2.6% | 3.3% |
| Median | 2.4% | 3.0% |
| Interquartile 25% (IQ1) | 1.9% | 1.6% |
| Interquartile 75% (IQ3) | 3.4% | 4.2% |
| Interquartile Range (IQR) | 1.5% | 2.6% |
| Standard Deviation (Sample) | 1.1% | 2.3% |
| Standard Deviation (Population) | 1.1% | 2.2% |
Demographics Similar to Immigrants from Cambodia and Tongans by Professional Degree
In terms of professional degree, the demographic groups most similar to Immigrants from Cambodia are Hopi (3.6%, a difference of 0.020%), Immigrants from Congo (3.6%, a difference of 0.040%), Central American Indian (3.6%, a difference of 0.36%), U.S. Virgin Islander (3.7%, a difference of 0.52%), and Immigrants from Guyana (3.7%, a difference of 0.53%). Similarly, the demographic groups most similar to Tongans are Pueblo (3.7%, a difference of 0.14%), Jamaican (3.7%, a difference of 0.24%), Immigrants from Nicaragua (3.7%, a difference of 0.39%), Osage (3.7%, a difference of 0.43%), and Iroquois (3.7%, a difference of 0.53%).
| Demographics | Rating | Rank | Professional Degree |
| Immigrants | Grenada | 1.5 /100 | #249 | Tragic 3.7% |
| Immigrants | Fiji | 1.5 /100 | #250 | Tragic 3.7% |
| Immigrants | Nicaragua | 1.4 /100 | #251 | Tragic 3.7% |
| Jamaicans | 1.4 /100 | #252 | Tragic 3.7% |
| Pueblo | 1.4 /100 | #253 | Tragic 3.7% |
| Tongans | 1.3 /100 | #254 | Tragic 3.7% |
| Osage | 1.2 /100 | #255 | Tragic 3.7% |
| Iroquois | 1.2 /100 | #256 | Tragic 3.7% |
| Bahamians | 1.1 /100 | #257 | Tragic 3.7% |
| Immigrants | St. Vincent and the Grenadines | 1.1 /100 | #258 | Tragic 3.7% |
| Africans | 1.0 /100 | #259 | Tragic 3.7% |
| Indonesians | 1.0 /100 | #260 | Tragic 3.7% |
| Immigrants | Guyana | 1.0 /100 | #261 | Tragic 3.7% |
| U.S. Virgin Islanders | 1.0 /100 | #262 | Tragic 3.7% |
| Hopi | 0.9 /100 | #263 | Tragic 3.6% |
| Immigrants | Cambodia | 0.9 /100 | #264 | Tragic 3.6% |
| Immigrants | Congo | 0.8 /100 | #265 | Tragic 3.6% |
| Central American Indians | 0.8 /100 | #266 | Tragic 3.6% |
| Delaware | 0.7 /100 | #267 | Tragic 3.6% |
| Aleuts | 0.7 /100 | #268 | Tragic 3.6% |
| Immigrants | Cuba | 0.6 /100 | #269 | Tragic 3.6% |