Immigrants from Afghanistan vs Mexican Master's Degree
COMPARE
Immigrants from Afghanistan
Mexican
Master's Degree
Master's Degree Comparison
Immigrants from Afghanistan
Mexicans
15.6%
MASTER'S DEGREE
79.4/ 100
METRIC RATING
146th/ 347
METRIC RANK
9.7%
MASTER'S DEGREE
0.0/ 100
METRIC RATING
337th/ 347
METRIC RANK
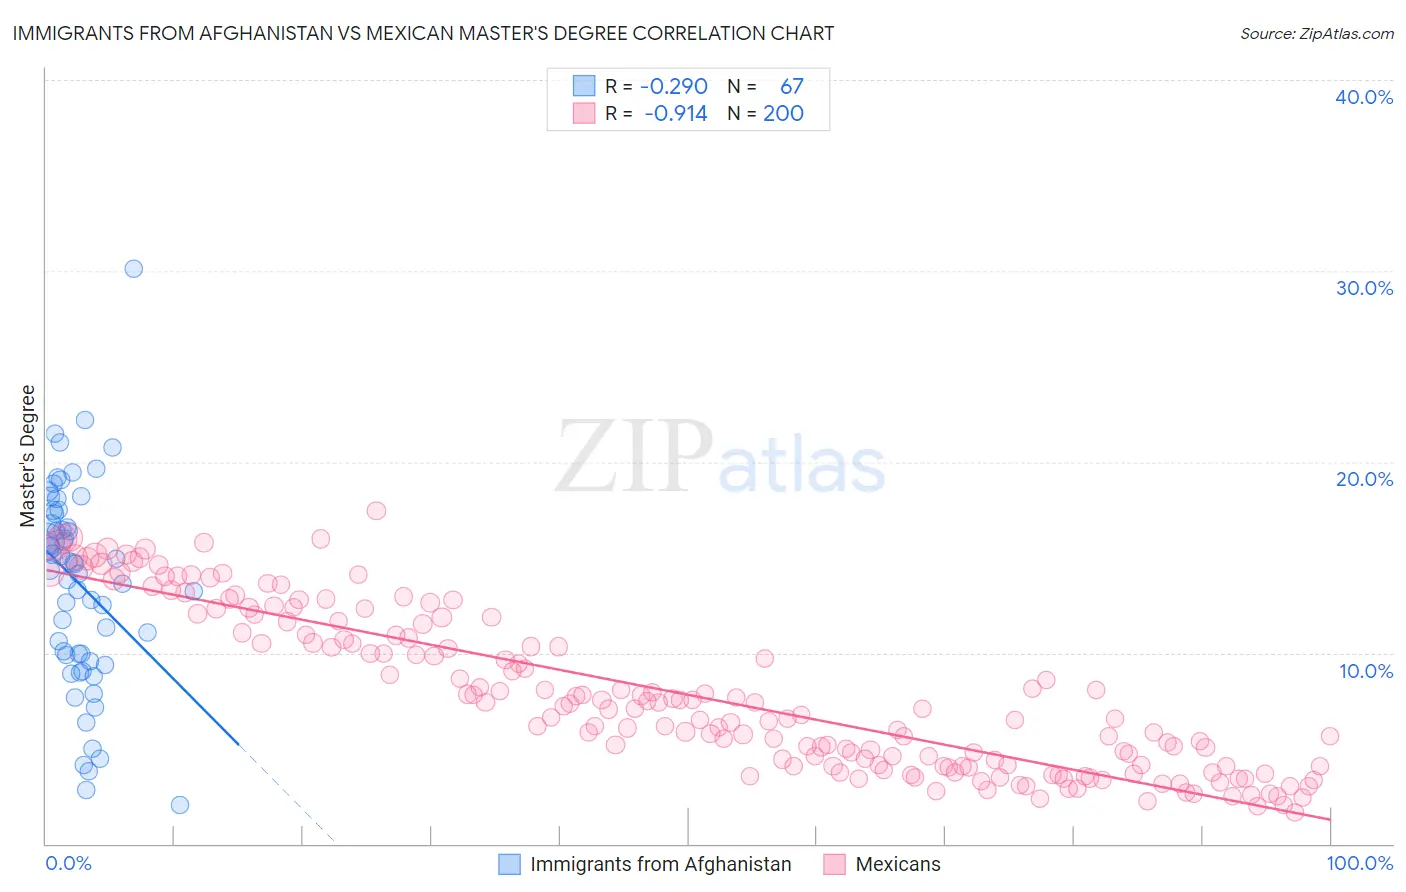
Immigrants from Afghanistan vs Mexican Master's Degree Correlation Chart
The statistical analysis conducted on geographies consisting of 147,637,931 people shows a weak negative correlation between the proportion of Immigrants from Afghanistan and percentage of population with at least master's degree education in the United States with a correlation coefficient (R) of -0.290 and weighted average of 15.6%. Similarly, the statistical analysis conducted on geographies consisting of 564,212,765 people shows a near-perfect negative correlation between the proportion of Mexicans and percentage of population with at least master's degree education in the United States with a correlation coefficient (R) of -0.914 and weighted average of 9.7%, a difference of 60.2%.
Master's Degree Correlation Summary
| Measurement | Immigrants from Afghanistan | Mexican |
| Minimum | 2.0% | 1.7% |
| Maximum | 30.1% | 17.4% |
| Range | 28.1% | 15.8% |
| Mean | 13.6% | 7.8% |
| Median | 14.7% | 7.1% |
| Interquartile 25% (IQ1) | 9.9% | 4.1% |
| Interquartile 75% (IQ3) | 17.3% | 11.3% |
| Interquartile Range (IQR) | 7.4% | 7.2% |
| Standard Deviation (Sample) | 5.3% | 4.1% |
| Standard Deviation (Population) | 5.2% | 4.1% |
Similar Demographics by Master's Degree
Demographics Similar to Immigrants from Afghanistan by Master's Degree
In terms of master's degree, the demographic groups most similar to Immigrants from Afghanistan are Hungarian (15.6%, a difference of 0.040%), Immigrants from Senegal (15.5%, a difference of 0.21%), Ghanaian (15.5%, a difference of 0.22%), Slovene (15.5%, a difference of 0.25%), and South American (15.6%, a difference of 0.37%).
| Demographics | Rating | Rank | Master's Degree |
| Immigrants | Germany | 85.9 /100 | #139 | Excellent 15.8% |
| Vietnamese | 85.5 /100 | #140 | Excellent 15.8% |
| Poles | 85.0 /100 | #141 | Excellent 15.7% |
| Immigrants | Africa | 84.0 /100 | #142 | Excellent 15.7% |
| Immigrants | Venezuela | 83.6 /100 | #143 | Excellent 15.7% |
| Canadians | 83.3 /100 | #144 | Excellent 15.7% |
| South Americans | 81.3 /100 | #145 | Excellent 15.6% |
| Immigrants | Afghanistan | 79.4 /100 | #146 | Good 15.6% |
| Hungarians | 79.1 /100 | #147 | Good 15.6% |
| Immigrants | Senegal | 78.2 /100 | #148 | Good 15.5% |
| Ghanaians | 78.2 /100 | #149 | Good 15.5% |
| Slovenes | 78.0 /100 | #150 | Good 15.5% |
| Iraqis | 77.3 /100 | #151 | Good 15.5% |
| Slavs | 77.0 /100 | #152 | Good 15.5% |
| Icelanders | 76.8 /100 | #153 | Good 15.5% |
Demographics Similar to Mexicans by Master's Degree
In terms of master's degree, the demographic groups most similar to Mexicans are Tohono O'odham (9.7%, a difference of 0.080%), Spanish American Indian (9.6%, a difference of 1.4%), Native/Alaskan (9.9%, a difference of 2.2%), Yakama (9.5%, a difference of 2.6%), and Immigrants from Central America (10.0%, a difference of 2.8%).
| Demographics | Rating | Rank | Master's Degree |
| Fijians | 0.0 /100 | #330 | Tragic 10.3% |
| Pueblo | 0.0 /100 | #331 | Tragic 10.3% |
| Immigrants | Azores | 0.0 /100 | #332 | Tragic 10.2% |
| Menominee | 0.0 /100 | #333 | Tragic 10.2% |
| Arapaho | 0.0 /100 | #334 | Tragic 10.0% |
| Immigrants | Central America | 0.0 /100 | #335 | Tragic 10.0% |
| Natives/Alaskans | 0.0 /100 | #336 | Tragic 9.9% |
| Mexicans | 0.0 /100 | #337 | Tragic 9.7% |
| Tohono O'odham | 0.0 /100 | #338 | Tragic 9.7% |
| Spanish American Indians | 0.0 /100 | #339 | Tragic 9.6% |
| Yakama | 0.0 /100 | #340 | Tragic 9.5% |
| Navajo | 0.0 /100 | #341 | Tragic 9.4% |
| Immigrants | Mexico | 0.0 /100 | #342 | Tragic 9.3% |
| Lumbee | 0.0 /100 | #343 | Tragic 9.3% |
| Pima | 0.0 /100 | #344 | Tragic 9.2% |