Immigrants from Afghanistan vs Immigrants from Albania Master's Degree
COMPARE
Immigrants from Afghanistan
Immigrants from Albania
Master's Degree
Master's Degree Comparison
Immigrants from Afghanistan
Immigrants from Albania
15.6%
MASTER'S DEGREE
79.4/ 100
METRIC RATING
146th/ 347
METRIC RANK
16.8%
MASTER'S DEGREE
98.1/ 100
METRIC RATING
106th/ 347
METRIC RANK
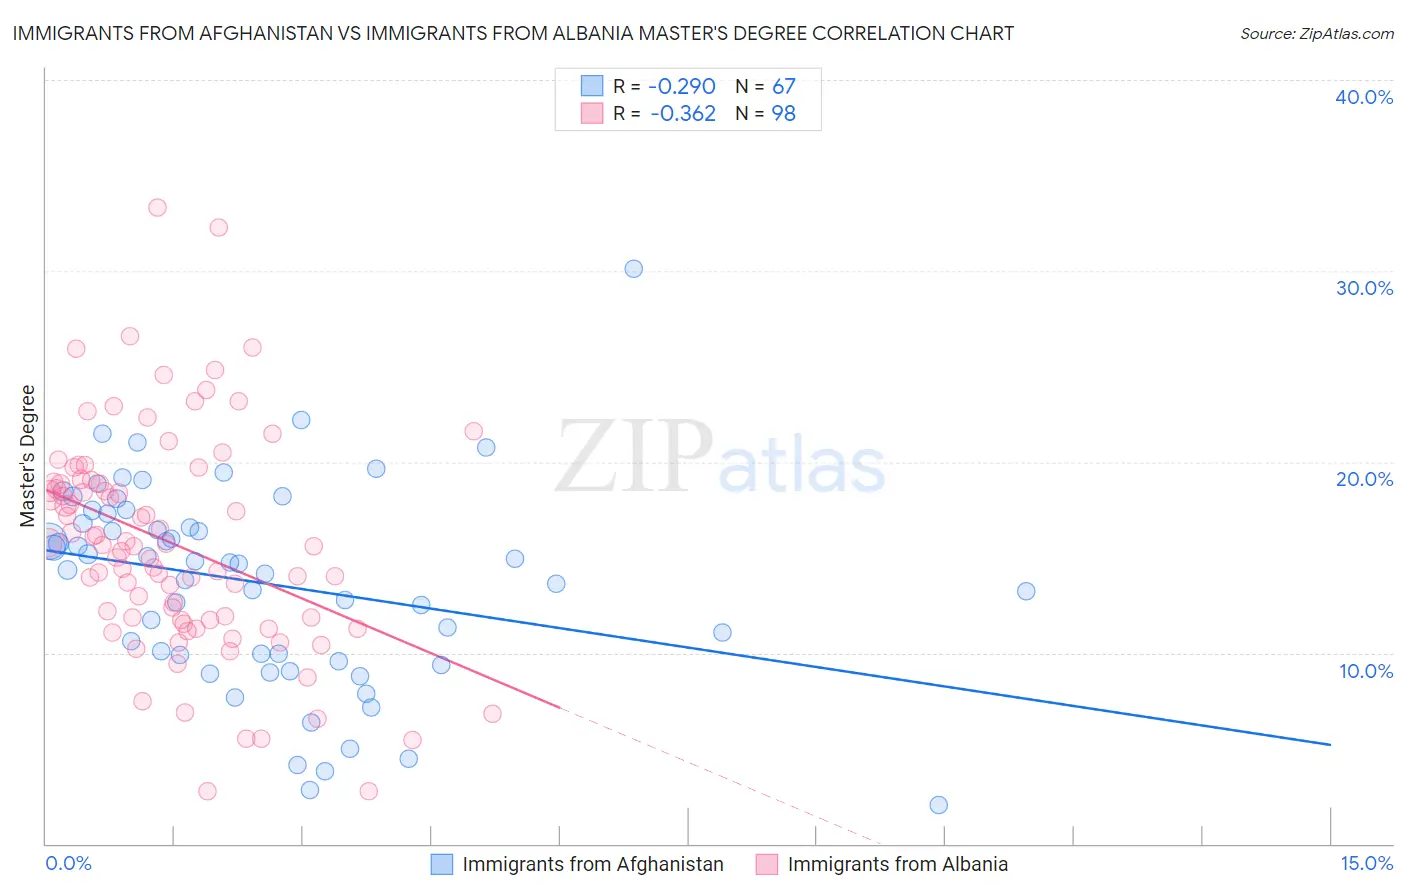
Immigrants from Afghanistan vs Immigrants from Albania Master's Degree Correlation Chart
The statistical analysis conducted on geographies consisting of 147,637,931 people shows a weak negative correlation between the proportion of Immigrants from Afghanistan and percentage of population with at least master's degree education in the United States with a correlation coefficient (R) of -0.290 and weighted average of 15.6%. Similarly, the statistical analysis conducted on geographies consisting of 119,391,185 people shows a mild negative correlation between the proportion of Immigrants from Albania and percentage of population with at least master's degree education in the United States with a correlation coefficient (R) of -0.362 and weighted average of 16.8%, a difference of 8.0%.
Master's Degree Correlation Summary
| Measurement | Immigrants from Afghanistan | Immigrants from Albania |
| Minimum | 2.0% | 2.7% |
| Maximum | 30.1% | 33.3% |
| Range | 28.1% | 30.6% |
| Mean | 13.6% | 15.7% |
| Median | 14.7% | 15.6% |
| Interquartile 25% (IQ1) | 9.9% | 11.7% |
| Interquartile 75% (IQ3) | 17.3% | 18.9% |
| Interquartile Range (IQR) | 7.4% | 7.1% |
| Standard Deviation (Sample) | 5.3% | 5.8% |
| Standard Deviation (Population) | 5.2% | 5.7% |
Similar Demographics by Master's Degree
Demographics Similar to Immigrants from Afghanistan by Master's Degree
In terms of master's degree, the demographic groups most similar to Immigrants from Afghanistan are Hungarian (15.6%, a difference of 0.040%), Immigrants from Senegal (15.5%, a difference of 0.21%), Ghanaian (15.5%, a difference of 0.22%), Slovene (15.5%, a difference of 0.25%), and South American (15.6%, a difference of 0.37%).
| Demographics | Rating | Rank | Master's Degree |
| Immigrants | Germany | 85.9 /100 | #139 | Excellent 15.8% |
| Vietnamese | 85.5 /100 | #140 | Excellent 15.8% |
| Poles | 85.0 /100 | #141 | Excellent 15.7% |
| Immigrants | Africa | 84.0 /100 | #142 | Excellent 15.7% |
| Immigrants | Venezuela | 83.6 /100 | #143 | Excellent 15.7% |
| Canadians | 83.3 /100 | #144 | Excellent 15.7% |
| South Americans | 81.3 /100 | #145 | Excellent 15.6% |
| Immigrants | Afghanistan | 79.4 /100 | #146 | Good 15.6% |
| Hungarians | 79.1 /100 | #147 | Good 15.6% |
| Immigrants | Senegal | 78.2 /100 | #148 | Good 15.5% |
| Ghanaians | 78.2 /100 | #149 | Good 15.5% |
| Slovenes | 78.0 /100 | #150 | Good 15.5% |
| Iraqis | 77.3 /100 | #151 | Good 15.5% |
| Slavs | 77.0 /100 | #152 | Good 15.5% |
| Icelanders | 76.8 /100 | #153 | Good 15.5% |
Demographics Similar to Immigrants from Albania by Master's Degree
In terms of master's degree, the demographic groups most similar to Immigrants from Albania are Armenian (16.8%, a difference of 0.090%), Sierra Leonean (16.8%, a difference of 0.12%), Moroccan (16.8%, a difference of 0.14%), Immigrants from Chile (16.8%, a difference of 0.17%), and Syrian (16.8%, a difference of 0.28%).
| Demographics | Rating | Rank | Master's Degree |
| Laotians | 98.8 /100 | #99 | Exceptional 17.0% |
| Albanians | 98.7 /100 | #100 | Exceptional 17.0% |
| Immigrants | Nepal | 98.6 /100 | #101 | Exceptional 17.0% |
| Chileans | 98.6 /100 | #102 | Exceptional 16.9% |
| Alsatians | 98.4 /100 | #103 | Exceptional 16.9% |
| Ukrainians | 98.3 /100 | #104 | Exceptional 16.9% |
| Syrians | 98.3 /100 | #105 | Exceptional 16.8% |
| Immigrants | Albania | 98.1 /100 | #106 | Exceptional 16.8% |
| Armenians | 98.0 /100 | #107 | Exceptional 16.8% |
| Sierra Leoneans | 98.0 /100 | #108 | Exceptional 16.8% |
| Moroccans | 98.0 /100 | #109 | Exceptional 16.8% |
| Immigrants | Chile | 98.0 /100 | #110 | Exceptional 16.8% |
| Austrians | 97.8 /100 | #111 | Exceptional 16.7% |
| Macedonians | 97.7 /100 | #112 | Exceptional 16.7% |
| Arabs | 97.7 /100 | #113 | Exceptional 16.7% |