Immigrants from Saudi Arabia vs Alaska Native 4th Grade
COMPARE
Immigrants from Saudi Arabia
Alaska Native
4th Grade
4th Grade Comparison
Immigrants from Saudi Arabia
Alaska Natives
97.8%
4TH GRADE
94.8/ 100
METRIC RATING
119th/ 347
METRIC RANK
98.4%
4TH GRADE
100.0/ 100
METRIC RATING
20th/ 347
METRIC RANK
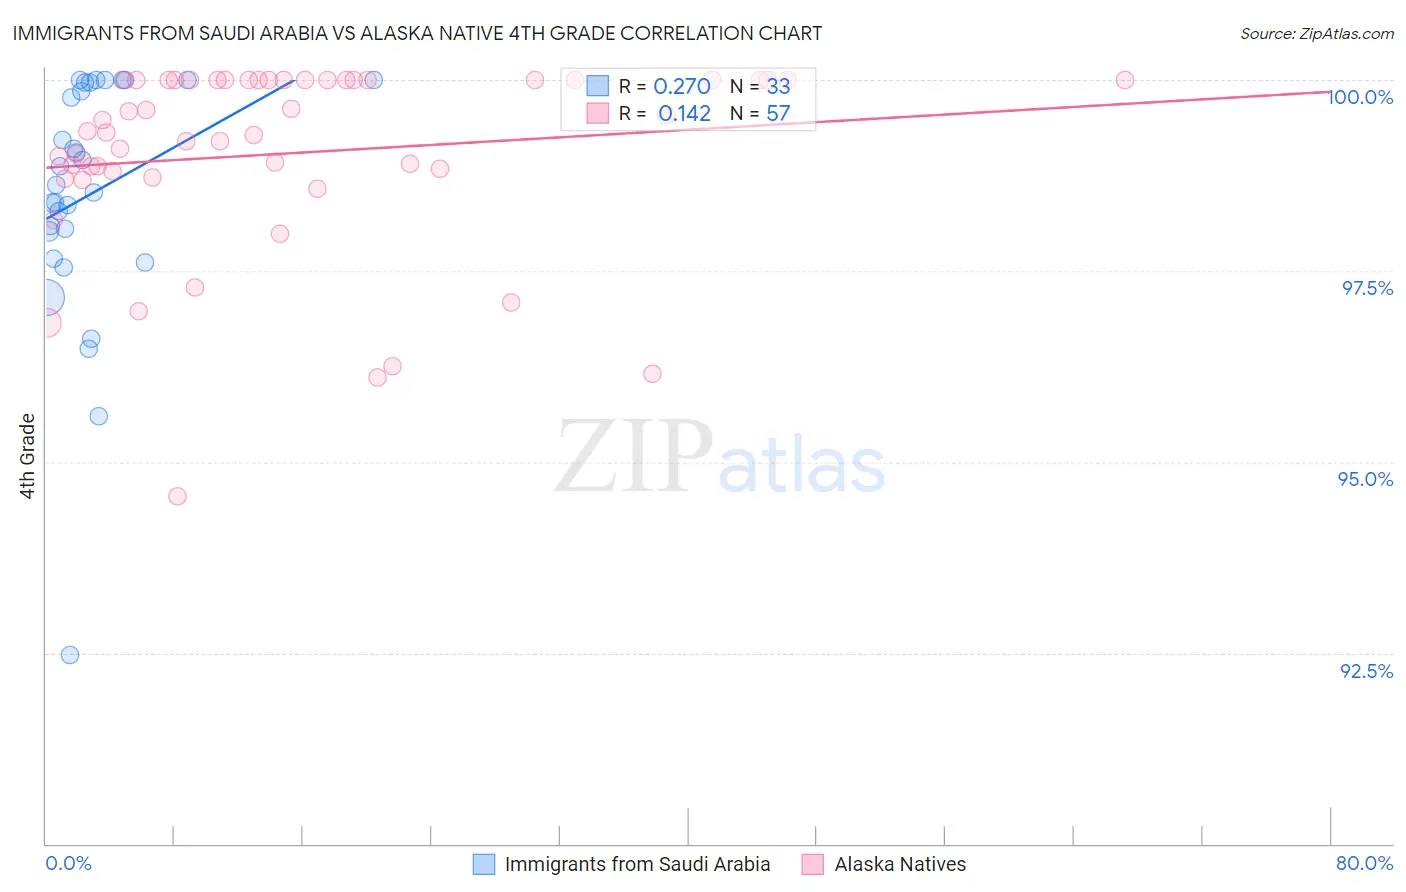
Immigrants from Saudi Arabia vs Alaska Native 4th Grade Correlation Chart
The statistical analysis conducted on geographies consisting of 164,277,573 people shows a weak positive correlation between the proportion of Immigrants from Saudi Arabia and percentage of population with at least 4th grade education in the United States with a correlation coefficient (R) of 0.270 and weighted average of 97.8%. Similarly, the statistical analysis conducted on geographies consisting of 76,775,774 people shows a poor positive correlation between the proportion of Alaska Natives and percentage of population with at least 4th grade education in the United States with a correlation coefficient (R) of 0.142 and weighted average of 98.4%, a difference of 0.58%.
4th Grade Correlation Summary
| Measurement | Immigrants from Saudi Arabia | Alaska Native |
| Minimum | 92.5% | 94.6% |
| Maximum | 100.0% | 100.0% |
| Range | 7.5% | 5.4% |
| Mean | 98.5% | 99.0% |
| Median | 98.6% | 99.3% |
| Interquartile 25% (IQ1) | 97.8% | 98.8% |
| Interquartile 75% (IQ3) | 100.0% | 100.0% |
| Interquartile Range (IQR) | 2.1% | 1.2% |
| Standard Deviation (Sample) | 1.6% | 1.2% |
| Standard Deviation (Population) | 1.6% | 1.2% |
Similar Demographics by 4th Grade
Demographics Similar to Immigrants from Saudi Arabia by 4th Grade
In terms of 4th grade, the demographic groups most similar to Immigrants from Saudi Arabia are Syrian (97.8%, a difference of 0.0%), Menominee (97.8%, a difference of 0.0%), Immigrants from France (97.8%, a difference of 0.0%), Iroquois (97.8%, a difference of 0.010%), and Lebanese (97.8%, a difference of 0.010%).
| Demographics | Rating | Rank | 4th Grade |
| Okinawans | 96.0 /100 | #112 | Exceptional 97.8% |
| Basques | 95.8 /100 | #113 | Exceptional 97.8% |
| Iroquois | 95.4 /100 | #114 | Exceptional 97.8% |
| Lebanese | 95.4 /100 | #115 | Exceptional 97.8% |
| Immigrants | Croatia | 95.2 /100 | #116 | Exceptional 97.8% |
| Syrians | 94.9 /100 | #117 | Exceptional 97.8% |
| Menominee | 94.9 /100 | #118 | Exceptional 97.8% |
| Immigrants | Saudi Arabia | 94.8 /100 | #119 | Exceptional 97.8% |
| Immigrants | France | 94.8 /100 | #120 | Exceptional 97.8% |
| Immigrants | Norway | 94.2 /100 | #121 | Exceptional 97.8% |
| Immigrants | Japan | 94.1 /100 | #122 | Exceptional 97.8% |
| Immigrants | Zimbabwe | 93.9 /100 | #123 | Exceptional 97.8% |
| Spanish | 93.7 /100 | #124 | Exceptional 97.8% |
| Immigrants | Serbia | 92.6 /100 | #125 | Exceptional 97.8% |
| Immigrants | Europe | 92.5 /100 | #126 | Exceptional 97.8% |
Demographics Similar to Alaska Natives by 4th Grade
In terms of 4th grade, the demographic groups most similar to Alaska Natives are Polish (98.4%, a difference of 0.010%), Irish (98.4%, a difference of 0.010%), Lithuanian (98.3%, a difference of 0.010%), Finnish (98.3%, a difference of 0.010%), and Dutch (98.4%, a difference of 0.020%).
| Demographics | Rating | Rank | 4th Grade |
| Swedes | 100.0 /100 | #13 | Exceptional 98.4% |
| Carpatho Rusyns | 100.0 /100 | #14 | Exceptional 98.4% |
| Dutch | 100.0 /100 | #15 | Exceptional 98.4% |
| Scottish | 100.0 /100 | #16 | Exceptional 98.4% |
| Pennsylvania Germans | 100.0 /100 | #17 | Exceptional 98.4% |
| Poles | 100.0 /100 | #18 | Exceptional 98.4% |
| Irish | 100.0 /100 | #19 | Exceptional 98.4% |
| Alaska Natives | 100.0 /100 | #20 | Exceptional 98.4% |
| Lithuanians | 100.0 /100 | #21 | Exceptional 98.3% |
| Finns | 100.0 /100 | #22 | Exceptional 98.3% |
| Sioux | 100.0 /100 | #23 | Exceptional 98.3% |
| Danes | 100.0 /100 | #24 | Exceptional 98.3% |
| Scotch-Irish | 100.0 /100 | #25 | Exceptional 98.3% |
| Croatians | 100.0 /100 | #26 | Exceptional 98.3% |
| French Canadians | 100.0 /100 | #27 | Exceptional 98.3% |