Guyanese vs Alaska Native 4th Grade
COMPARE
Guyanese
Alaska Native
4th Grade
4th Grade Comparison
Guyanese
Alaska Natives
96.4%
4TH GRADE
0.0/ 100
METRIC RATING
303rd/ 347
METRIC RANK
98.4%
4TH GRADE
100.0/ 100
METRIC RATING
20th/ 347
METRIC RANK
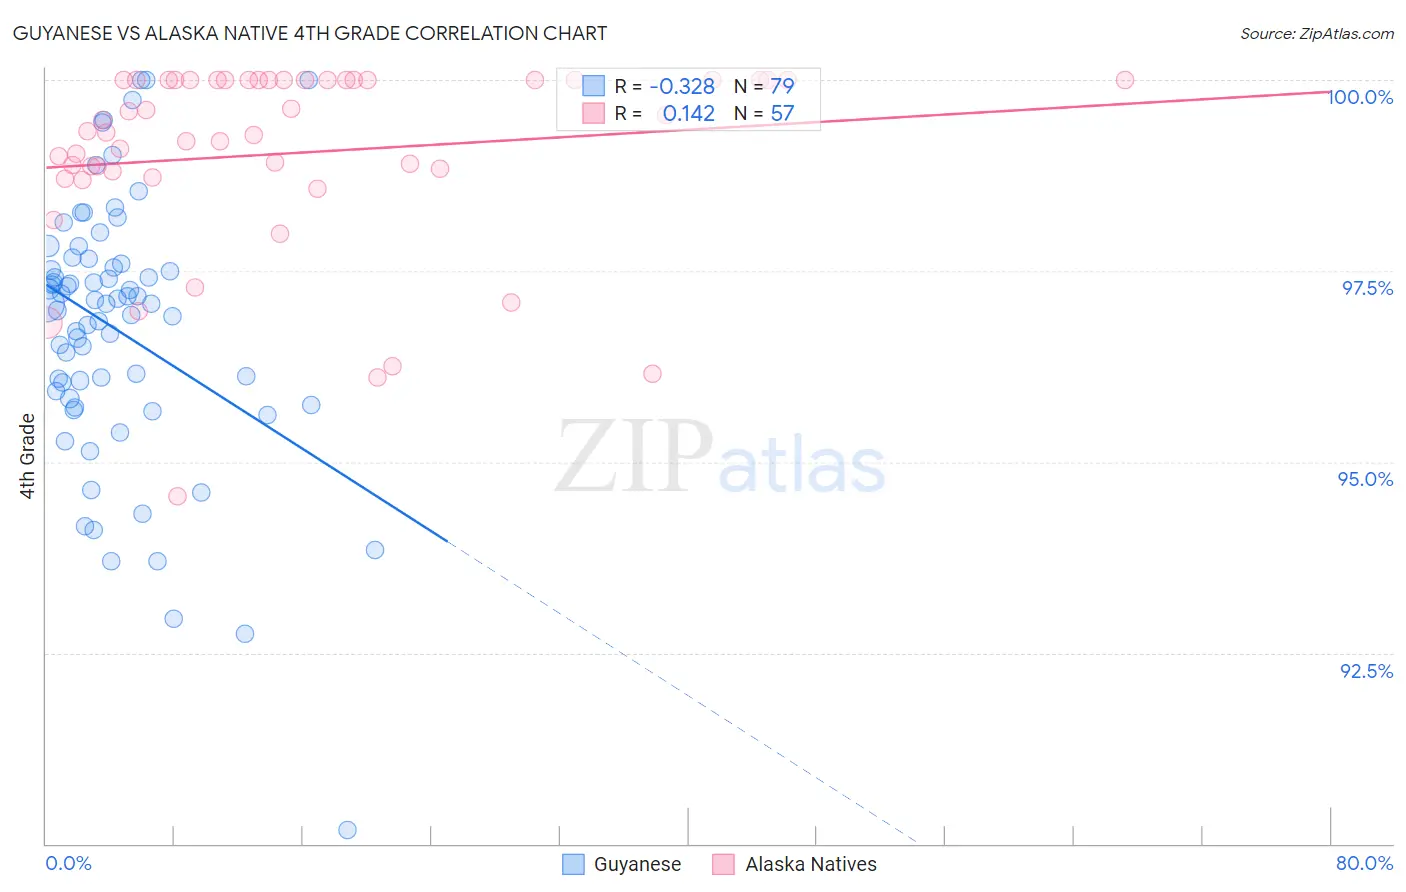
Guyanese vs Alaska Native 4th Grade Correlation Chart
The statistical analysis conducted on geographies consisting of 176,921,765 people shows a mild negative correlation between the proportion of Guyanese and percentage of population with at least 4th grade education in the United States with a correlation coefficient (R) of -0.328 and weighted average of 96.4%. Similarly, the statistical analysis conducted on geographies consisting of 76,775,774 people shows a poor positive correlation between the proportion of Alaska Natives and percentage of population with at least 4th grade education in the United States with a correlation coefficient (R) of 0.142 and weighted average of 98.4%, a difference of 2.0%.
4th Grade Correlation Summary
| Measurement | Guyanese | Alaska Native |
| Minimum | 90.2% | 94.6% |
| Maximum | 100.0% | 100.0% |
| Range | 9.8% | 5.4% |
| Mean | 96.7% | 99.0% |
| Median | 97.1% | 99.3% |
| Interquartile 25% (IQ1) | 95.8% | 98.8% |
| Interquartile 75% (IQ3) | 97.6% | 100.0% |
| Interquartile Range (IQR) | 1.8% | 1.2% |
| Standard Deviation (Sample) | 1.7% | 1.2% |
| Standard Deviation (Population) | 1.7% | 1.2% |
Similar Demographics by 4th Grade
Demographics Similar to Guyanese by 4th Grade
In terms of 4th grade, the demographic groups most similar to Guyanese are Ecuadorian (96.4%, a difference of 0.010%), Immigrants from Caribbean (96.4%, a difference of 0.030%), Sri Lankan (96.4%, a difference of 0.040%), Immigrants from Cuba (96.4%, a difference of 0.050%), and Immigrants from Haiti (96.3%, a difference of 0.070%).
| Demographics | Rating | Rank | 4th Grade |
| Somalis | 0.0 /100 | #296 | Tragic 96.6% |
| Immigrants | Somalia | 0.0 /100 | #297 | Tragic 96.5% |
| Haitians | 0.0 /100 | #298 | Tragic 96.5% |
| Immigrants | Dominica | 0.0 /100 | #299 | Tragic 96.5% |
| Immigrants | South Eastern Asia | 0.0 /100 | #300 | Tragic 96.5% |
| Immigrants | Immigrants | 0.0 /100 | #301 | Tragic 96.5% |
| Immigrants | Cuba | 0.0 /100 | #302 | Tragic 96.4% |
| Guyanese | 0.0 /100 | #303 | Tragic 96.4% |
| Ecuadorians | 0.0 /100 | #304 | Tragic 96.4% |
| Immigrants | Caribbean | 0.0 /100 | #305 | Tragic 96.4% |
| Sri Lankans | 0.0 /100 | #306 | Tragic 96.4% |
| Immigrants | Haiti | 0.0 /100 | #307 | Tragic 96.3% |
| Immigrants | Laos | 0.0 /100 | #308 | Tragic 96.3% |
| Immigrants | Guyana | 0.0 /100 | #309 | Tragic 96.3% |
| Immigrants | Burma/Myanmar | 0.0 /100 | #310 | Tragic 96.3% |
Demographics Similar to Alaska Natives by 4th Grade
In terms of 4th grade, the demographic groups most similar to Alaska Natives are Polish (98.4%, a difference of 0.010%), Irish (98.4%, a difference of 0.010%), Lithuanian (98.3%, a difference of 0.010%), Finnish (98.3%, a difference of 0.010%), and Dutch (98.4%, a difference of 0.020%).
| Demographics | Rating | Rank | 4th Grade |
| Swedes | 100.0 /100 | #13 | Exceptional 98.4% |
| Carpatho Rusyns | 100.0 /100 | #14 | Exceptional 98.4% |
| Dutch | 100.0 /100 | #15 | Exceptional 98.4% |
| Scottish | 100.0 /100 | #16 | Exceptional 98.4% |
| Pennsylvania Germans | 100.0 /100 | #17 | Exceptional 98.4% |
| Poles | 100.0 /100 | #18 | Exceptional 98.4% |
| Irish | 100.0 /100 | #19 | Exceptional 98.4% |
| Alaska Natives | 100.0 /100 | #20 | Exceptional 98.4% |
| Lithuanians | 100.0 /100 | #21 | Exceptional 98.3% |
| Finns | 100.0 /100 | #22 | Exceptional 98.3% |
| Sioux | 100.0 /100 | #23 | Exceptional 98.3% |
| Danes | 100.0 /100 | #24 | Exceptional 98.3% |
| Scotch-Irish | 100.0 /100 | #25 | Exceptional 98.3% |
| Croatians | 100.0 /100 | #26 | Exceptional 98.3% |
| French Canadians | 100.0 /100 | #27 | Exceptional 98.3% |