Hungarian vs Immigrants from Zimbabwe Professional Degree

COMPARE

Hungarian
Race
Ancestry
AfghanAfricanAlaska NativeAlaskan AthabascanAlbanianAleutAlsatianAmericanApacheArabArapahoArgentineanArmenianAssyrian/Chaldean/SyriacAustralianAustrianBahamianBangladeshiBarbadianBasqueBelgianBelizeanBermudanBhutaneseBlackfeetBolivianBrazilianBritishBritish West IndianBulgarianBurmeseCajunCambodianCanadianCape VerdeanCarpatho RusynCelticCentral AmericanCentral American IndianCherokeeCheyenneChickasawChileanChineseChippewaChoctawColombianColvilleComancheCosta RicanCreeCreekCroatianCrowCubanCypriotCzechCzechoslovakianDanishDelawareDominicanDutchDutch West IndianEastern EuropeanEcuadorianEgyptianEnglishEstonianEthiopianEuropeanFijianFilipinoFinnishFrenchFrench American IndianFrench CanadianGermanGerman RussianGhanaianGreekGuamanian/ChamorroGuatemalanGuyaneseHaitianHmongHonduranHopiHoumaHungarianIcelanderIndian (Asian)IndonesianInupiatIranianIraqiIrishIroquoisIsraeliItalianJamaicanJapaneseJordanianKenyanKiowaKoreanLaotianLatvianLebaneseLiberianLithuanianLumbeeLuxembourgerMacedonianMalaysianMalteseMarshalleseMenomineeMexicanMexican American IndianMongolianMoroccanNative HawaiianNavajoNepaleseNew ZealanderNicaraguanNigerianNorthern EuropeanNorwegianOkinawanOsageOttawaPaiutePakistaniPalestinianPanamanianParaguayanPennsylvania GermanPeruvianPimaPolishPortuguesePotawatomiPuebloPuerto RicanPuget Sound SalishRomanianRussianSalvadoranSamoanScandinavianScotch-IrishScottishSeminoleSenegaleseSerbianShoshoneSierra LeoneanSiouxSlavicSlovakSloveneSomaliSouth AfricanSouth AmericanSouth American IndianSoviet UnionSpaniardSpanishSpanish AmericanSpanish American IndianSri LankanSubsaharan AfricanSudaneseSwedishSwissSyrianTaiwaneseThaiTlingit-HaidaTohono O'OdhamTonganTrinidadian and TobagonianTsimshianTurkishU.S. Virgin IslanderUgandanUkrainianUruguayanUteVenezuelanVietnameseWelshWest IndianYakamaYaquiYugoslavianYumanYup'ikZimbabwean
Immigration
NonimmigrantsImmigrantsAfghanistanAfricaAlbaniaArgentinaArmeniaAsiaAustraliaAustriaBahamasBangladeshBarbadosBelarusBelgiumBelizeBoliviaBosnia and HerzegovinaBrazilBulgariaBurma/MyanmarCabo VerdeCambodiaCameroonCanadaCaribbeanCentral AmericaChileChinaColombiaCongoCosta RicaCroatiaCubaCzechoslovakiaDenmarkDominicaDominican RepublicEastern AfricaEastern AsiaEastern EuropeEcuadorEgyptEl SalvadorEnglandEritreaEthiopiaEuropeFijiFranceGermanyGhanaGreeceGrenadaGuatemalaGuyanaHaitiHondurasHong KongHungaryIndiaIndonesiaIranIraqIrelandIsraelItalyJamaicaJapanJordanKazakhstanKenyaKoreaKuwaitLaosLatin AmericaLatviaLebanonLiberiaLithuaniaMalaysiaMexicoMicronesiaMiddle AfricaMoldovaMoroccoNepalNetherlandsNicaraguaNigeriaNorth AmericaNorth MacedoniaNorthern AfricaNorthern EuropeNorwayOceaniaPakistanPanamaPeruPhilippinesPolandPortugalRomaniaRussiaSaudi ArabiaScotlandSenegalSerbiaSierra LeoneSingaporeSomaliaSouth AfricaSouth AmericaSouth Central AsiaSouth Eastern AsiaSouthern EuropeSpainSri LankaSt. Vincent and the GrenadinesSudanSwedenSwitzerlandSyriaTaiwanThailandTrinidad and TobagoTurkeyUgandaUkraineUruguayUzbekistanVenezuelaVietnamWest IndiesWestern AfricaWestern AsiaWestern EuropeYemenZaireAzores
Immigrants from Zimbabwe
Race
Ancestry
AfghanAfricanAlaska NativeAlaskan AthabascanAlbanianAleutAlsatianAmericanApacheArabArapahoArgentineanArmenianAssyrian/Chaldean/SyriacAustralianAustrianBahamianBangladeshiBarbadianBasqueBelgianBelizeanBermudanBhutaneseBlackfeetBolivianBrazilianBritishBritish West IndianBulgarianBurmeseCajunCambodianCanadianCape VerdeanCarpatho RusynCelticCentral AmericanCentral American IndianCherokeeCheyenneChickasawChileanChineseChippewaChoctawColombianColvilleComancheCosta RicanCreeCreekCroatianCrowCubanCypriotCzechCzechoslovakianDanishDelawareDominicanDutchDutch West IndianEastern EuropeanEcuadorianEgyptianEnglishEstonianEthiopianEuropeanFijianFilipinoFinnishFrenchFrench American IndianFrench CanadianGermanGerman RussianGhanaianGreekGuamanian/ChamorroGuatemalanGuyaneseHaitianHmongHonduranHopiHoumaIcelanderIndian (Asian)IndonesianInupiatIranianIraqiIrishIroquoisIsraeliItalianJamaicanJapaneseJordanianKenyanKiowaKoreanLaotianLatvianLebaneseLiberianLithuanianLumbeeLuxembourgerMacedonianMalaysianMalteseMarshalleseMenomineeMexicanMexican American IndianMongolianMoroccanNative HawaiianNavajoNepaleseNew ZealanderNicaraguanNigerianNorthern EuropeanNorwegianOkinawanOsageOttawaPaiutePakistaniPalestinianPanamanianParaguayanPennsylvania GermanPeruvianPimaPolishPortuguesePotawatomiPuebloPuerto RicanPuget Sound SalishRomanianRussianSalvadoranSamoanScandinavianScotch-IrishScottishSeminoleSenegaleseSerbianShoshoneSierra LeoneanSiouxSlavicSlovakSloveneSomaliSouth AfricanSouth AmericanSouth American IndianSoviet UnionSpaniardSpanishSpanish AmericanSpanish American IndianSri LankanSubsaharan AfricanSudaneseSwedishSwissSyrianTaiwaneseThaiTlingit-HaidaTohono O'OdhamTonganTrinidadian and TobagonianTsimshianTurkishU.S. Virgin IslanderUgandanUkrainianUruguayanUteVenezuelanVietnameseWelshWest IndianYakamaYaquiYugoslavianYumanYup'ikZimbabwean
Immigration
NonimmigrantsImmigrantsAfghanistanAfricaAlbaniaArgentinaArmeniaAsiaAustraliaAustriaBahamasBangladeshBarbadosBelarusBelgiumBelizeBoliviaBosnia and HerzegovinaBrazilBulgariaBurma/MyanmarCabo VerdeCambodiaCameroonCanadaCaribbeanCentral AmericaChileChinaColombiaCongoCosta RicaCroatiaCubaCzechoslovakiaDenmarkDominicaDominican RepublicEastern AfricaEastern AsiaEastern EuropeEcuadorEgyptEl SalvadorEnglandEritreaEthiopiaEuropeFijiFranceGermanyGhanaGreeceGrenadaGuatemalaGuyanaHaitiHondurasHong KongHungaryIndiaIndonesiaIranIraqIrelandIsraelItalyJamaicaJapanJordanKazakhstanKenyaKoreaKuwaitLaosLatin AmericaLatviaLebanonLiberiaLithuaniaMalaysiaMexicoMicronesiaMiddle AfricaMoldovaMoroccoNepalNetherlandsNicaraguaNigeriaNorth AmericaNorth MacedoniaNorthern AfricaNorthern EuropeNorwayOceaniaPakistanPanamaPeruPhilippinesPolandPortugalRomaniaRussiaSaudi ArabiaScotlandSenegalSerbiaSierra LeoneSingaporeSomaliaSouth AfricaSouth AmericaSouth Central AsiaSouth Eastern AsiaSouthern EuropeSpainSri LankaSt. Vincent and the GrenadinesSudanSwedenSwitzerlandSyriaTaiwanThailandTrinidad and TobagoTurkeyUgandaUkraineUruguayUzbekistanVenezuelaVietnamWest IndiesWestern AfricaWestern AsiaWestern EuropeYemenZaireZimbabweAzores
Professional Degree
Income
Poverty
Unemployment
Labor Participation
Family Structure
Vehicle Availability
Education Level
Disability

Professional Degree Comparison

Hungarians

Immigrants from Zimbabwe

Excellent
Exceptional
4.6%
PROFESSIONAL DEGREE
80.8/ 100
METRIC RATING
143rd/ 347
METRIC RANK
5.3%
PROFESSIONAL DEGREE
99.6/ 100
METRIC RATING
85th/ 347
METRIC RANK

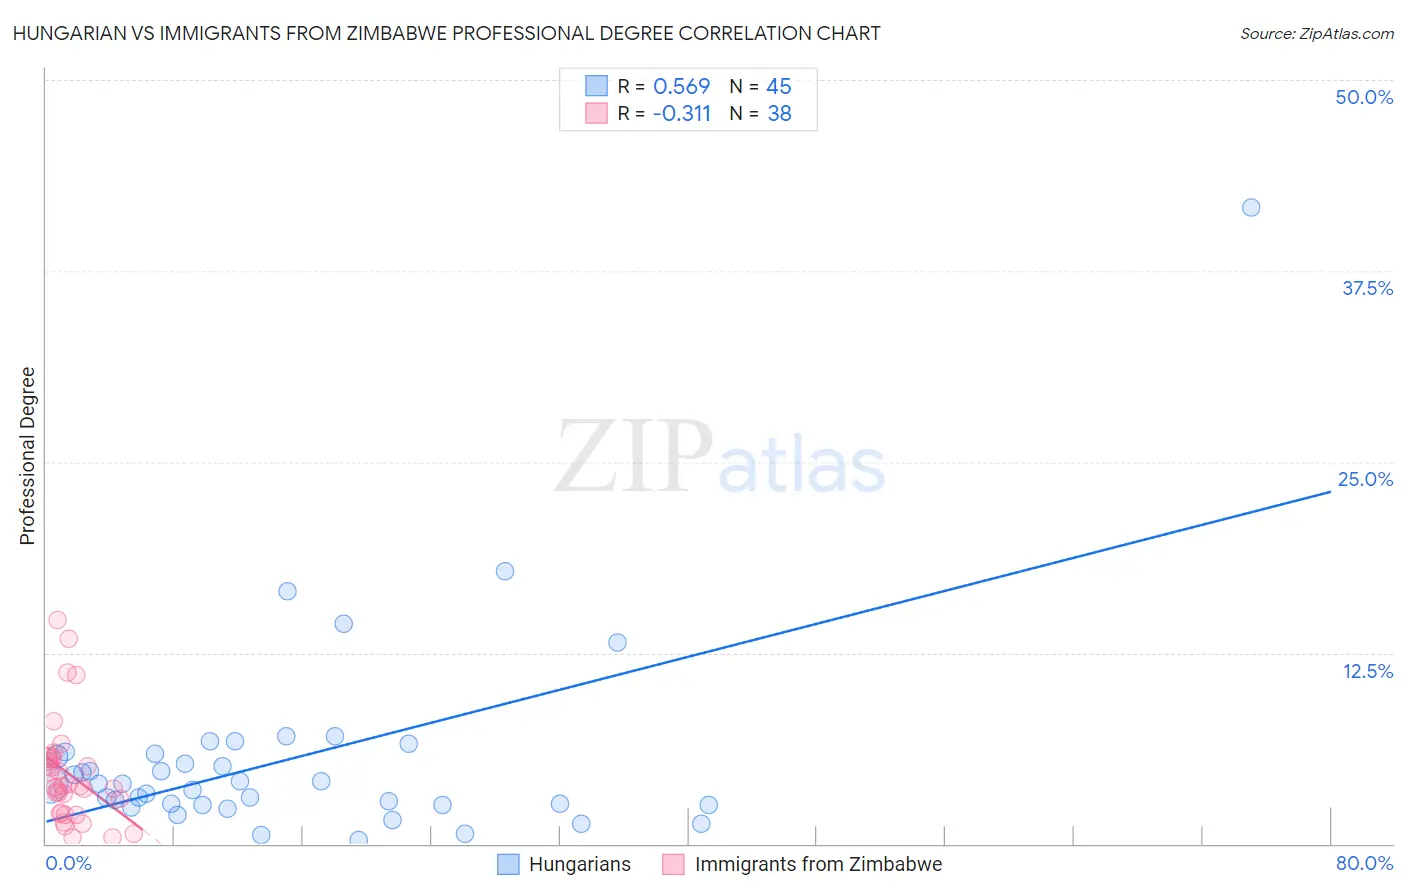
Hungarian vs Immigrants from Zimbabwe Professional Degree Correlation Chart

The statistical analysis conducted on geographies consisting of 483,808,546 people shows a substantial positive correlation between the proportion of Hungarians and percentage of population with at least professional degree education in the United States with a correlation coefficient (R) of 0.569 and weighted average of 4.6%. Similarly, the statistical analysis conducted on geographies consisting of 117,758,651 people shows a mild negative correlation between the proportion of Immigrants from Zimbabwe and percentage of population with at least professional degree education in the United States with a correlation coefficient (R) of -0.311 and weighted average of 5.3%, a difference of 13.7%.
Hungarian vs Immigrants from Zimbabwe Professional Degree

Professional Degree Correlation Summary

MeasurementHungarianImmigrants from Zimbabwe
Minimum0.21%0.39%
Maximum41.7%14.6%
Range41.5%14.2%
Mean5.6%4.6%
Median3.9%3.8%
Interquartile 25% (IQ1)2.5%2.0%
Interquartile 75% (IQ3)5.9%5.6%
Interquartile Range (IQR)3.4%3.6%
Standard Deviation (Sample)6.7%3.3%
Standard Deviation (Population)6.6%3.3%

Similar Demographics by Professional Degree

Demographics Similar to Hungarians by Professional Degree

In terms of professional degree, the demographic groups most similar to Hungarians are Immigrants from South America (4.6%, a difference of 0.070%), Sudanese (4.6%, a difference of 0.11%), Uruguayan (4.6%, a difference of 0.13%), Basque (4.6%, a difference of 0.24%), and Luxembourger (4.6%, a difference of 0.44%).
DemographicsRating | RankProfessional Degree
Immigrants | Jordan
89.0
/100
|
#136
Excellent
4.7%
Jordanians
88.9
/100
|
#137
Excellent
4.7%
Afghans
88.8
/100
|
#138
Excellent
4.7%
South Americans
85.6
/100
|
#139
Excellent
4.7%
Canadians
84.4
/100
|
#140
Excellent
4.7%
Basques
81.8
/100
|
#141
Excellent
4.6%
Sudanese
81.3
/100
|
#142
Excellent
4.6%
Hungarians
80.8
/100
|
#143
Excellent
4.6%
Immigrants | South America
80.5
/100
|
#144
Excellent
4.6%
Uruguayans
80.2
/100
|
#145
Excellent
4.6%
Luxembourgers
78.7
/100
|
#146
Good
4.6%
Colombians
77.7
/100
|
#147
Good
4.6%
Slovenes
76.1
/100
|
#148
Good
4.6%
Senegalese
75.3
/100
|
#149
Good
4.6%
Immigrants | Oceania
73.4
/100
|
#150
Good
4.6%

Demographics Similar to Immigrants from Zimbabwe by Professional Degree

In terms of professional degree, the demographic groups most similar to Immigrants from Zimbabwe are Greek (5.3%, a difference of 0.0%), Carpatho Rusyn (5.3%, a difference of 0.020%), Immigrants from Croatia (5.3%, a difference of 0.020%), Immigrants from Chile (5.3%, a difference of 0.11%), and Romanian (5.3%, a difference of 0.22%).
DemographicsRating | RankProfessional Degree
Armenians
99.7
/100
|
#78
Exceptional
5.3%
Immigrants | North America
99.7
/100
|
#79
Exceptional
5.3%
Immigrants | England
99.6
/100
|
#80
Exceptional
5.3%
Immigrants | Brazil
99.6
/100
|
#81
Exceptional
5.3%
Romanians
99.6
/100
|
#82
Exceptional
5.3%
Carpatho Rusyns
99.6
/100
|
#83
Exceptional
5.3%
Immigrants | Croatia
99.6
/100
|
#84
Exceptional
5.3%
Immigrants | Zimbabwe
99.6
/100
|
#85
Exceptional
5.3%
Greeks
99.6
/100
|
#86
Exceptional
5.3%
Immigrants | Chile
99.5
/100
|
#87
Exceptional
5.3%
Egyptians
99.5
/100
|
#88
Exceptional
5.3%
Chileans
99.5
/100
|
#89
Exceptional
5.3%
Immigrants | Scotland
99.5
/100
|
#90
Exceptional
5.3%
Laotians
99.5
/100
|
#91
Exceptional
5.2%
Immigrants | Eastern Europe
99.5
/100
|
#92
Exceptional
5.2%