Immigrants from South Central Asia vs Immigrants from Dominican Republic No Schooling Completed
COMPARE
Immigrants from South Central Asia
Immigrants from Dominican Republic
No Schooling Completed
No Schooling Completed Comparison
Immigrants from South Central Asia
Immigrants from Dominican Republic
2.0%
NO SCHOOLING COMPLETED
80.0/ 100
METRIC RATING
143rd/ 347
METRIC RANK
3.4%
NO SCHOOLING COMPLETED
0.0/ 100
METRIC RATING
333rd/ 347
METRIC RANK
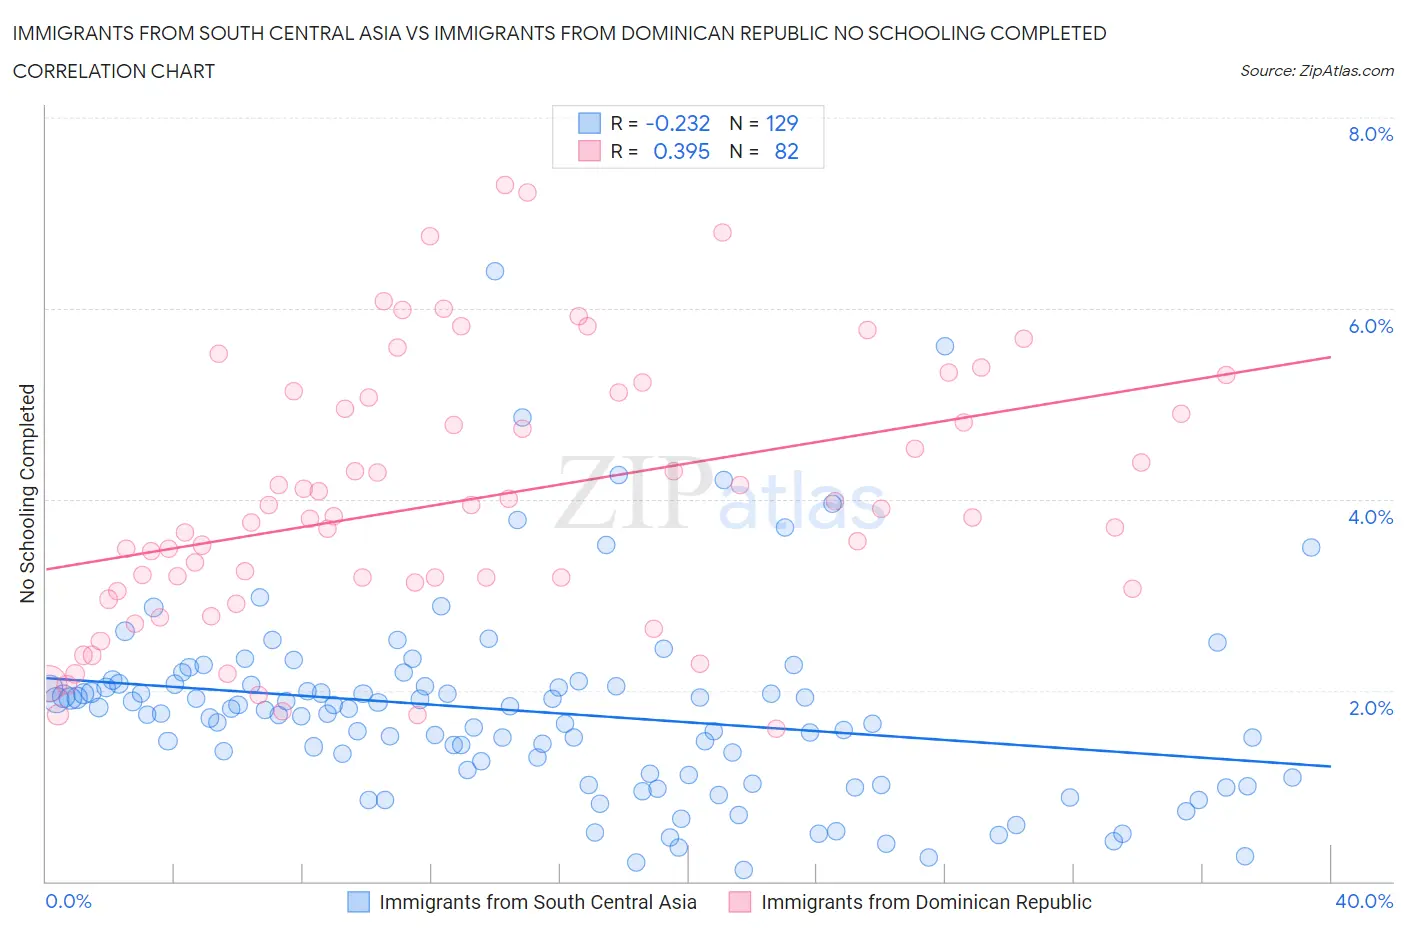
Immigrants from South Central Asia vs Immigrants from Dominican Republic No Schooling Completed Correlation Chart
The statistical analysis conducted on geographies consisting of 466,715,377 people shows a weak negative correlation between the proportion of Immigrants from South Central Asia and percentage of population with no schooling in the United States with a correlation coefficient (R) of -0.232 and weighted average of 2.0%. Similarly, the statistical analysis conducted on geographies consisting of 273,675,959 people shows a mild positive correlation between the proportion of Immigrants from Dominican Republic and percentage of population with no schooling in the United States with a correlation coefficient (R) of 0.395 and weighted average of 3.4%, a difference of 70.5%.
No Schooling Completed Correlation Summary
| Measurement | Immigrants from South Central Asia | Immigrants from Dominican Republic |
| Minimum | 0.12% | 1.6% |
| Maximum | 6.4% | 7.3% |
| Range | 6.3% | 5.7% |
| Mean | 1.8% | 4.0% |
| Median | 1.8% | 3.8% |
| Interquartile 25% (IQ1) | 1.1% | 3.1% |
| Interquartile 75% (IQ3) | 2.1% | 5.1% |
| Interquartile Range (IQR) | 0.95% | 2.0% |
| Standard Deviation (Sample) | 1.0% | 1.4% |
| Standard Deviation (Population) | 1.0% | 1.4% |
Similar Demographics by No Schooling Completed
Demographics Similar to Immigrants from South Central Asia by No Schooling Completed
In terms of no schooling completed, the demographic groups most similar to Immigrants from South Central Asia are Alsatian (2.0%, a difference of 0.20%), Immigrants from Iran (2.0%, a difference of 0.21%), Venezuelan (2.0%, a difference of 0.35%), Immigrants from Moldova (2.0%, a difference of 0.42%), and Soviet Union (2.0%, a difference of 0.60%).
| Demographics | Rating | Rank | No Schooling Completed |
| Burmese | 88.2 /100 | #136 | Excellent 1.9% |
| Filipinos | 85.5 /100 | #137 | Excellent 2.0% |
| Immigrants | Israel | 85.4 /100 | #138 | Excellent 2.0% |
| Jordanians | 84.5 /100 | #139 | Excellent 2.0% |
| Marshallese | 83.5 /100 | #140 | Excellent 2.0% |
| Immigrants | Greece | 83.5 /100 | #141 | Excellent 2.0% |
| Venezuelans | 81.5 /100 | #142 | Excellent 2.0% |
| Immigrants | South Central Asia | 80.0 /100 | #143 | Good 2.0% |
| Alsatians | 79.1 /100 | #144 | Good 2.0% |
| Immigrants | Iran | 79.0 /100 | #145 | Good 2.0% |
| Immigrants | Moldova | 78.0 /100 | #146 | Good 2.0% |
| Soviet Union | 77.1 /100 | #147 | Good 2.0% |
| Shoshone | 76.7 /100 | #148 | Good 2.0% |
| Immigrants | North Macedonia | 75.9 /100 | #149 | Good 2.0% |
| Blackfeet | 72.9 /100 | #150 | Good 2.0% |
Demographics Similar to Immigrants from Dominican Republic by No Schooling Completed
In terms of no schooling completed, the demographic groups most similar to Immigrants from Dominican Republic are Central American (3.4%, a difference of 0.060%), Japanese (3.3%, a difference of 1.6%), Immigrants from Armenia (3.3%, a difference of 1.6%), Guatemalan (3.5%, a difference of 1.8%), and Immigrants from Vietnam (3.3%, a difference of 2.0%).
| Demographics | Rating | Rank | No Schooling Completed |
| Indonesians | 0.0 /100 | #326 | Tragic 3.2% |
| Immigrants | Latin America | 0.0 /100 | #327 | Tragic 3.3% |
| Mexicans | 0.0 /100 | #328 | Tragic 3.3% |
| Immigrants | Vietnam | 0.0 /100 | #329 | Tragic 3.3% |
| Immigrants | Armenia | 0.0 /100 | #330 | Tragic 3.3% |
| Japanese | 0.0 /100 | #331 | Tragic 3.3% |
| Central Americans | 0.0 /100 | #332 | Tragic 3.4% |
| Immigrants | Dominican Republic | 0.0 /100 | #333 | Tragic 3.4% |
| Guatemalans | 0.0 /100 | #334 | Tragic 3.5% |
| Immigrants | Cambodia | 0.0 /100 | #335 | Tragic 3.5% |
| Immigrants | Fiji | 0.0 /100 | #336 | Tragic 3.5% |
| Immigrants | Cabo Verde | 0.0 /100 | #337 | Tragic 3.5% |
| Bangladeshis | 0.0 /100 | #338 | Tragic 3.5% |
| Yakama | 0.0 /100 | #339 | Tragic 3.6% |
| Immigrants | Guatemala | 0.0 /100 | #340 | Tragic 3.6% |