Immigrants from India vs Immigrants from Dominican Republic No Schooling Completed
COMPARE
Immigrants from India
Immigrants from Dominican Republic
No Schooling Completed
No Schooling Completed Comparison
Immigrants from India
Immigrants from Dominican Republic
1.7%
NO SCHOOLING COMPLETED
99.4/ 100
METRIC RATING
73rd/ 347
METRIC RANK
3.4%
NO SCHOOLING COMPLETED
0.0/ 100
METRIC RATING
333rd/ 347
METRIC RANK
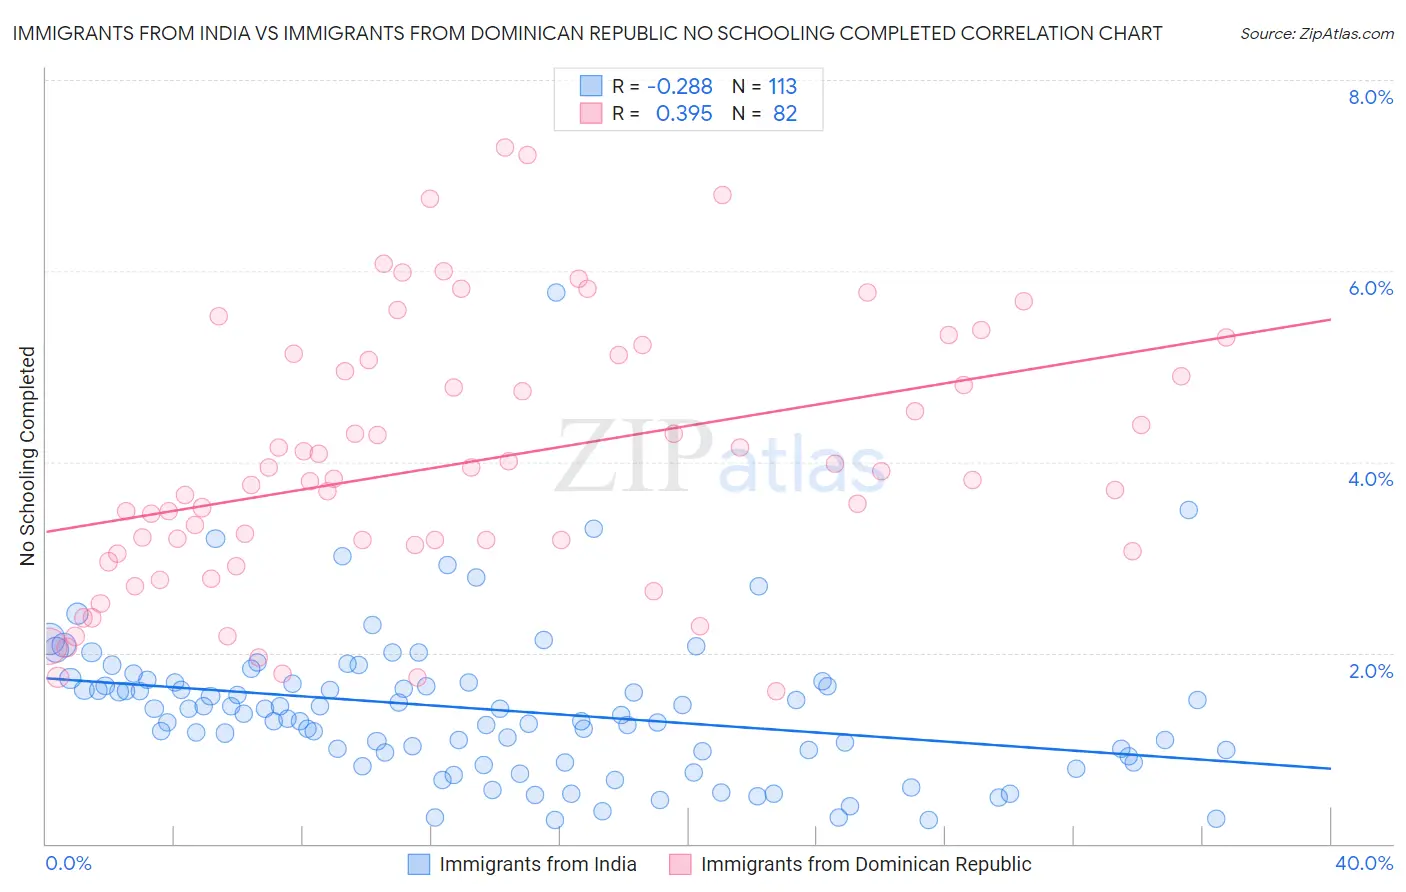
Immigrants from India vs Immigrants from Dominican Republic No Schooling Completed Correlation Chart
The statistical analysis conducted on geographies consisting of 429,114,118 people shows a weak negative correlation between the proportion of Immigrants from India and percentage of population with no schooling in the United States with a correlation coefficient (R) of -0.288 and weighted average of 1.7%. Similarly, the statistical analysis conducted on geographies consisting of 273,675,959 people shows a mild positive correlation between the proportion of Immigrants from Dominican Republic and percentage of population with no schooling in the United States with a correlation coefficient (R) of 0.395 and weighted average of 3.4%, a difference of 96.7%.
No Schooling Completed Correlation Summary
| Measurement | Immigrants from India | Immigrants from Dominican Republic |
| Minimum | 0.25% | 1.6% |
| Maximum | 5.8% | 7.3% |
| Range | 5.5% | 5.7% |
| Mean | 1.4% | 4.0% |
| Median | 1.4% | 3.8% |
| Interquartile 25% (IQ1) | 0.94% | 3.1% |
| Interquartile 75% (IQ3) | 1.7% | 5.1% |
| Interquartile Range (IQR) | 0.75% | 2.0% |
| Standard Deviation (Sample) | 0.79% | 1.4% |
| Standard Deviation (Population) | 0.78% | 1.4% |
Similar Demographics by No Schooling Completed
Demographics Similar to Immigrants from India by No Schooling Completed
In terms of no schooling completed, the demographic groups most similar to Immigrants from India are Zimbabwean (1.7%, a difference of 0.020%), Cajun (1.7%, a difference of 0.48%), Immigrants from Belgium (1.7%, a difference of 0.60%), Immigrants from England (1.7%, a difference of 0.65%), and Cherokee (1.7%, a difference of 0.65%).
| Demographics | Rating | Rank | No Schooling Completed |
| Canadians | 99.7 /100 | #66 | Exceptional 1.7% |
| Immigrants | Austria | 99.7 /100 | #67 | Exceptional 1.7% |
| Immigrants | Lithuania | 99.7 /100 | #68 | Exceptional 1.7% |
| Chickasaw | 99.6 /100 | #69 | Exceptional 1.7% |
| Immigrants | Netherlands | 99.6 /100 | #70 | Exceptional 1.7% |
| Immigrants | England | 99.5 /100 | #71 | Exceptional 1.7% |
| Cajuns | 99.5 /100 | #72 | Exceptional 1.7% |
| Immigrants | India | 99.4 /100 | #73 | Exceptional 1.7% |
| Zimbabweans | 99.4 /100 | #74 | Exceptional 1.7% |
| Immigrants | Belgium | 99.3 /100 | #75 | Exceptional 1.7% |
| Cherokee | 99.3 /100 | #76 | Exceptional 1.7% |
| Immigrants | Sweden | 99.3 /100 | #77 | Exceptional 1.7% |
| Delaware | 99.3 /100 | #78 | Exceptional 1.7% |
| Macedonians | 99.3 /100 | #79 | Exceptional 1.7% |
| Cypriots | 99.3 /100 | #80 | Exceptional 1.7% |
Demographics Similar to Immigrants from Dominican Republic by No Schooling Completed
In terms of no schooling completed, the demographic groups most similar to Immigrants from Dominican Republic are Central American (3.4%, a difference of 0.060%), Japanese (3.3%, a difference of 1.6%), Immigrants from Armenia (3.3%, a difference of 1.6%), Guatemalan (3.5%, a difference of 1.8%), and Immigrants from Vietnam (3.3%, a difference of 2.0%).
| Demographics | Rating | Rank | No Schooling Completed |
| Indonesians | 0.0 /100 | #326 | Tragic 3.2% |
| Immigrants | Latin America | 0.0 /100 | #327 | Tragic 3.3% |
| Mexicans | 0.0 /100 | #328 | Tragic 3.3% |
| Immigrants | Vietnam | 0.0 /100 | #329 | Tragic 3.3% |
| Immigrants | Armenia | 0.0 /100 | #330 | Tragic 3.3% |
| Japanese | 0.0 /100 | #331 | Tragic 3.3% |
| Central Americans | 0.0 /100 | #332 | Tragic 3.4% |
| Immigrants | Dominican Republic | 0.0 /100 | #333 | Tragic 3.4% |
| Guatemalans | 0.0 /100 | #334 | Tragic 3.5% |
| Immigrants | Cambodia | 0.0 /100 | #335 | Tragic 3.5% |
| Immigrants | Fiji | 0.0 /100 | #336 | Tragic 3.5% |
| Immigrants | Cabo Verde | 0.0 /100 | #337 | Tragic 3.5% |
| Bangladeshis | 0.0 /100 | #338 | Tragic 3.5% |
| Yakama | 0.0 /100 | #339 | Tragic 3.6% |
| Immigrants | Guatemala | 0.0 /100 | #340 | Tragic 3.6% |