Panamanian vs Thai 8th Grade
COMPARE
Panamanian
Thai
8th Grade
8th Grade Comparison
Panamanians
Thais
95.6%
8TH GRADE
28.4/ 100
METRIC RATING
193rd/ 347
METRIC RANK
96.4%
8TH GRADE
98.9/ 100
METRIC RATING
91st/ 347
METRIC RANK
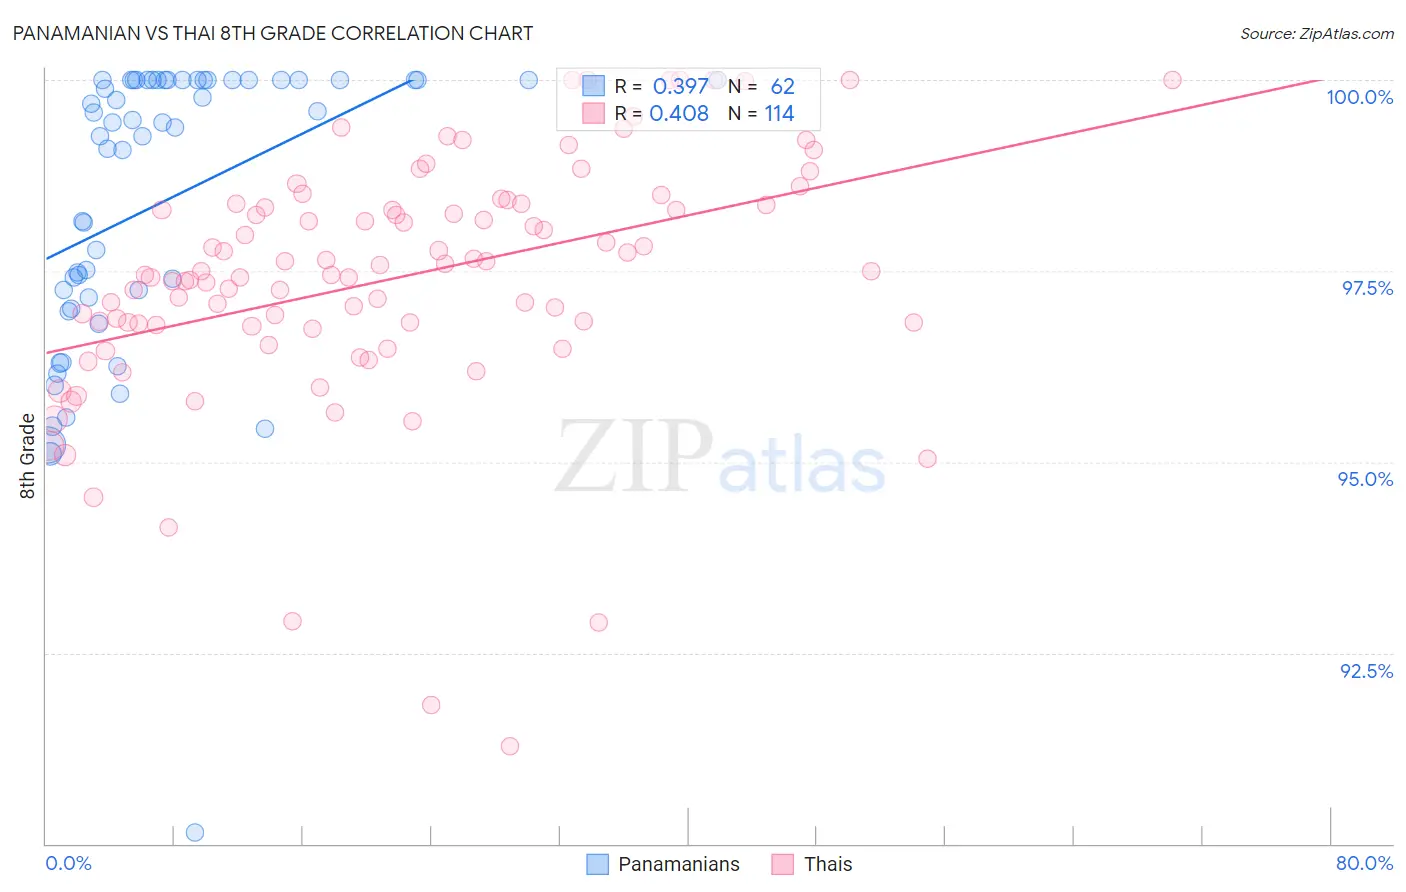
Panamanian vs Thai 8th Grade Correlation Chart
The statistical analysis conducted on geographies consisting of 281,248,945 people shows a mild positive correlation between the proportion of Panamanians and percentage of population with at least 8th grade education in the United States with a correlation coefficient (R) of 0.397 and weighted average of 95.6%. Similarly, the statistical analysis conducted on geographies consisting of 475,814,962 people shows a moderate positive correlation between the proportion of Thais and percentage of population with at least 8th grade education in the United States with a correlation coefficient (R) of 0.408 and weighted average of 96.4%, a difference of 0.87%.
8th Grade Correlation Summary
| Measurement | Panamanian | Thai |
| Minimum | 90.1% | 91.3% |
| Maximum | 100.0% | 100.0% |
| Range | 9.9% | 8.7% |
| Mean | 98.4% | 97.4% |
| Median | 99.4% | 97.5% |
| Interquartile 25% (IQ1) | 97.2% | 96.8% |
| Interquartile 75% (IQ3) | 100.0% | 98.4% |
| Interquartile Range (IQR) | 2.8% | 1.6% |
| Standard Deviation (Sample) | 2.0% | 1.6% |
| Standard Deviation (Population) | 1.9% | 1.6% |
Similar Demographics by 8th Grade
Demographics Similar to Panamanians by 8th Grade
In terms of 8th grade, the demographic groups most similar to Panamanians are Pima (95.6%, a difference of 0.0%), Immigrants from Nepal (95.6%, a difference of 0.010%), Guamanian/Chamorro (95.6%, a difference of 0.010%), Immigrants from Micronesia (95.6%, a difference of 0.020%), and Immigrants from Venezuela (95.6%, a difference of 0.020%).
| Demographics | Rating | Rank | 8th Grade |
| Brazilians | 34.8 /100 | #186 | Fair 95.6% |
| Sudanese | 33.0 /100 | #187 | Fair 95.6% |
| Liberians | 32.4 /100 | #188 | Fair 95.6% |
| Immigrants | Micronesia | 31.6 /100 | #189 | Fair 95.6% |
| Immigrants | Venezuela | 30.8 /100 | #190 | Fair 95.6% |
| Immigrants | Nepal | 30.2 /100 | #191 | Fair 95.6% |
| Pima | 28.6 /100 | #192 | Fair 95.6% |
| Panamanians | 28.4 /100 | #193 | Fair 95.6% |
| Guamanians/Chamorros | 26.6 /100 | #194 | Fair 95.6% |
| Immigrants | Zaire | 25.2 /100 | #195 | Fair 95.6% |
| Assyrians/Chaldeans/Syriacs | 24.5 /100 | #196 | Fair 95.6% |
| Sierra Leoneans | 24.3 /100 | #197 | Fair 95.6% |
| Paraguayans | 22.6 /100 | #198 | Fair 95.5% |
| Immigrants | Northern Africa | 22.5 /100 | #199 | Fair 95.5% |
| Argentineans | 22.2 /100 | #200 | Fair 95.5% |
Demographics Similar to Thais by 8th Grade
In terms of 8th grade, the demographic groups most similar to Thais are Immigrants from Sweden (96.4%, a difference of 0.0%), Menominee (96.4%, a difference of 0.0%), Immigrants from Denmark (96.4%, a difference of 0.0%), Chickasaw (96.4%, a difference of 0.010%), and Immigrants from Singapore (96.4%, a difference of 0.010%).
| Demographics | Rating | Rank | 8th Grade |
| Immigrants | Belgium | 99.1 /100 | #84 | Exceptional 96.5% |
| Immigrants | South Africa | 99.1 /100 | #85 | Exceptional 96.5% |
| Cherokee | 99.0 /100 | #86 | Exceptional 96.5% |
| Immigrants | Australia | 99.0 /100 | #87 | Exceptional 96.5% |
| Immigrants | Western Europe | 99.0 /100 | #88 | Exceptional 96.4% |
| Chickasaw | 98.9 /100 | #89 | Exceptional 96.4% |
| Immigrants | Sweden | 98.9 /100 | #90 | Exceptional 96.4% |
| Thais | 98.9 /100 | #91 | Exceptional 96.4% |
| Menominee | 98.9 /100 | #92 | Exceptional 96.4% |
| Immigrants | Denmark | 98.8 /100 | #93 | Exceptional 96.4% |
| Immigrants | Singapore | 98.8 /100 | #94 | Exceptional 96.4% |
| German Russians | 98.8 /100 | #95 | Exceptional 96.4% |
| Potawatomi | 98.7 /100 | #96 | Exceptional 96.4% |
| Osage | 98.7 /100 | #97 | Exceptional 96.4% |
| Immigrants | Germany | 98.7 /100 | #98 | Exceptional 96.4% |