Houma vs British Professional Degree
COMPARE
Houma
British
Professional Degree
Professional Degree Comparison
Houma
British
2.2%
PROFESSIONAL DEGREE
0.0/ 100
METRIC RATING
347th/ 347
METRIC RANK
5.0%
PROFESSIONAL DEGREE
98.0/ 100
METRIC RATING
109th/ 347
METRIC RANK
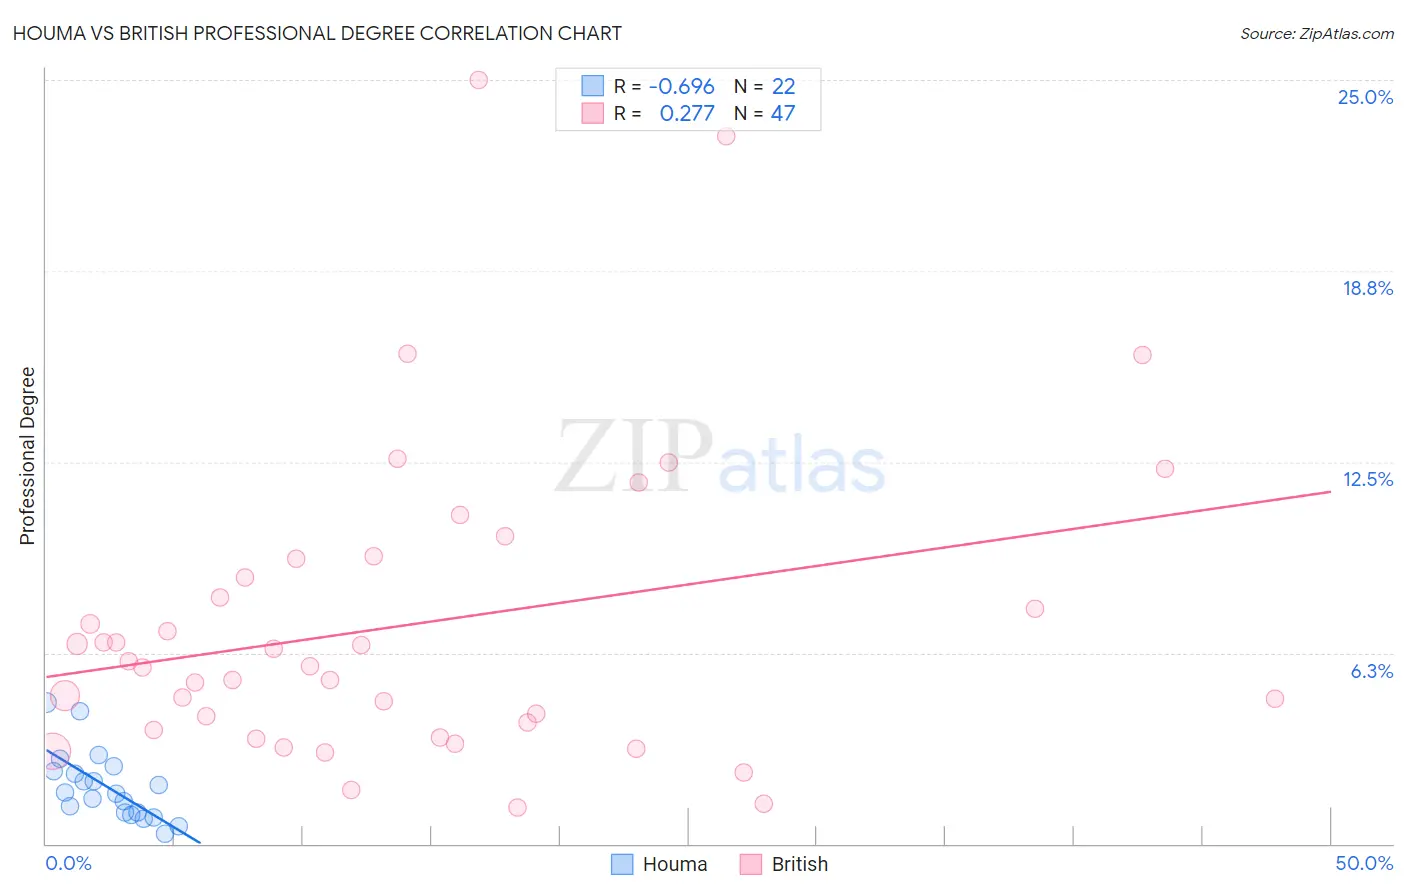
Houma vs British Professional Degree Correlation Chart
The statistical analysis conducted on geographies consisting of 36,689,629 people shows a significant negative correlation between the proportion of Houma and percentage of population with at least professional degree education in the United States with a correlation coefficient (R) of -0.696 and weighted average of 2.2%. Similarly, the statistical analysis conducted on geographies consisting of 527,483,146 people shows a weak positive correlation between the proportion of British and percentage of population with at least professional degree education in the United States with a correlation coefficient (R) of 0.277 and weighted average of 5.0%, a difference of 127.1%.
Professional Degree Correlation Summary
| Measurement | Houma | British |
| Minimum | 0.35% | 1.2% |
| Maximum | 4.6% | 25.0% |
| Range | 4.3% | 23.8% |
| Mean | 1.9% | 7.2% |
| Median | 1.7% | 5.8% |
| Interquartile 25% (IQ1) | 1.0% | 3.7% |
| Interquartile 75% (IQ3) | 2.4% | 9.3% |
| Interquartile Range (IQR) | 1.4% | 5.6% |
| Standard Deviation (Sample) | 1.1% | 5.1% |
| Standard Deviation (Population) | 1.1% | 5.0% |
Similar Demographics by Professional Degree
Demographics Similar to Houma by Professional Degree
In terms of professional degree, the demographic groups most similar to Houma are Lumbee (2.5%, a difference of 11.1%), Immigrants from Mexico (2.6%, a difference of 19.3%), Spanish American Indian (2.7%, a difference of 19.7%), Mexican (2.7%, a difference of 24.0%), and Immigrants from the Azores (2.8%, a difference of 27.6%).
| Demographics | Rating | Rank | Professional Degree |
| Puget Sound Salish | 0.0 /100 | #333 | Tragic 3.1% |
| Pennsylvania Germans | 0.0 /100 | #334 | Tragic 3.0% |
| Natives/Alaskans | 0.0 /100 | #335 | Tragic 3.0% |
| Fijians | 0.0 /100 | #336 | Tragic 2.9% |
| Arapaho | 0.0 /100 | #337 | Tragic 2.9% |
| Navajo | 0.0 /100 | #338 | Tragic 2.9% |
| Immigrants | Central America | 0.0 /100 | #339 | Tragic 2.9% |
| Yup'ik | 0.0 /100 | #340 | Tragic 2.9% |
| Tohono O'odham | 0.0 /100 | #341 | Tragic 2.8% |
| Immigrants | Azores | 0.0 /100 | #342 | Tragic 2.8% |
| Mexicans | 0.0 /100 | #343 | Tragic 2.7% |
| Spanish American Indians | 0.0 /100 | #344 | Tragic 2.7% |
| Immigrants | Mexico | 0.0 /100 | #345 | Tragic 2.6% |
| Lumbee | 0.0 /100 | #346 | Tragic 2.5% |
| Houma | 0.0 /100 | #347 | Tragic 2.2% |
Demographics Similar to British by Professional Degree
In terms of professional degree, the demographic groups most similar to British are Immigrants from Southern Europe (5.0%, a difference of 0.020%), Maltese (5.0%, a difference of 0.060%), Lebanese (5.0%, a difference of 0.15%), Immigrants from Ukraine (5.0%, a difference of 0.18%), and Immigrants from Uganda (5.0%, a difference of 0.21%).
| Demographics | Rating | Rank | Professional Degree |
| Ukrainians | 98.5 /100 | #102 | Exceptional 5.1% |
| Immigrants | Northern Africa | 98.4 /100 | #103 | Exceptional 5.1% |
| Arabs | 98.2 /100 | #104 | Exceptional 5.0% |
| Immigrants | Uganda | 98.2 /100 | #105 | Exceptional 5.0% |
| Immigrants | Ukraine | 98.2 /100 | #106 | Exceptional 5.0% |
| Maltese | 98.1 /100 | #107 | Exceptional 5.0% |
| Immigrants | Southern Europe | 98.1 /100 | #108 | Exceptional 5.0% |
| British | 98.0 /100 | #109 | Exceptional 5.0% |
| Lebanese | 98.0 /100 | #110 | Exceptional 5.0% |
| Brazilians | 97.4 /100 | #111 | Exceptional 5.0% |
| Taiwanese | 97.3 /100 | #112 | Exceptional 5.0% |
| Immigrants | Pakistan | 97.2 /100 | #113 | Exceptional 5.0% |
| Immigrants | Morocco | 96.8 /100 | #114 | Exceptional 5.0% |
| Moroccans | 96.8 /100 | #115 | Exceptional 5.0% |
| Venezuelans | 96.3 /100 | #116 | Exceptional 4.9% |