Houma vs Immigrants from Panama Professional Degree
COMPARE
Houma
Immigrants from Panama
Professional Degree
Professional Degree Comparison
Houma
Immigrants from Panama
2.2%
PROFESSIONAL DEGREE
0.0/ 100
METRIC RATING
347th/ 347
METRIC RANK
4.1%
PROFESSIONAL DEGREE
12.3/ 100
METRIC RATING
209th/ 347
METRIC RANK
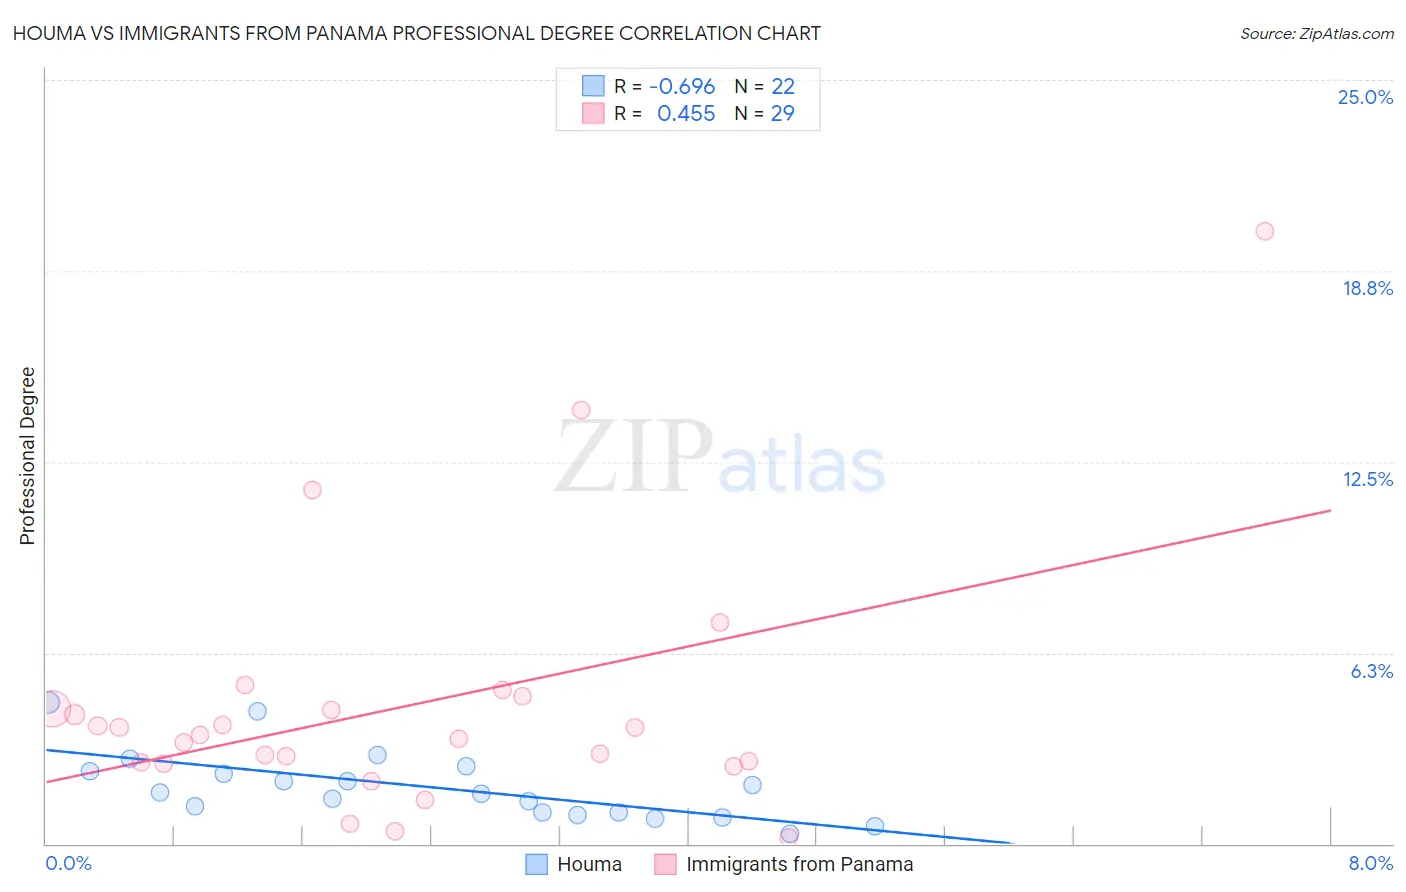
Houma vs Immigrants from Panama Professional Degree Correlation Chart
The statistical analysis conducted on geographies consisting of 36,689,629 people shows a significant negative correlation between the proportion of Houma and percentage of population with at least professional degree education in the United States with a correlation coefficient (R) of -0.696 and weighted average of 2.2%. Similarly, the statistical analysis conducted on geographies consisting of 221,001,104 people shows a moderate positive correlation between the proportion of Immigrants from Panama and percentage of population with at least professional degree education in the United States with a correlation coefficient (R) of 0.455 and weighted average of 4.1%, a difference of 84.6%.
Professional Degree Correlation Summary
| Measurement | Houma | Immigrants from Panama |
| Minimum | 0.35% | 0.20% |
| Maximum | 4.6% | 20.0% |
| Range | 4.3% | 19.9% |
| Mean | 1.9% | 4.5% |
| Median | 1.7% | 3.6% |
| Interquartile 25% (IQ1) | 1.0% | 2.6% |
| Interquartile 75% (IQ3) | 2.4% | 4.6% |
| Interquartile Range (IQR) | 1.4% | 2.0% |
| Standard Deviation (Sample) | 1.1% | 4.2% |
| Standard Deviation (Population) | 1.1% | 4.1% |
Similar Demographics by Professional Degree
Demographics Similar to Houma by Professional Degree
In terms of professional degree, the demographic groups most similar to Houma are Lumbee (2.5%, a difference of 11.1%), Immigrants from Mexico (2.6%, a difference of 19.3%), Spanish American Indian (2.7%, a difference of 19.7%), Mexican (2.7%, a difference of 24.0%), and Immigrants from the Azores (2.8%, a difference of 27.6%).
| Demographics | Rating | Rank | Professional Degree |
| Puget Sound Salish | 0.0 /100 | #333 | Tragic 3.1% |
| Pennsylvania Germans | 0.0 /100 | #334 | Tragic 3.0% |
| Natives/Alaskans | 0.0 /100 | #335 | Tragic 3.0% |
| Fijians | 0.0 /100 | #336 | Tragic 2.9% |
| Arapaho | 0.0 /100 | #337 | Tragic 2.9% |
| Navajo | 0.0 /100 | #338 | Tragic 2.9% |
| Immigrants | Central America | 0.0 /100 | #339 | Tragic 2.9% |
| Yup'ik | 0.0 /100 | #340 | Tragic 2.9% |
| Tohono O'odham | 0.0 /100 | #341 | Tragic 2.8% |
| Immigrants | Azores | 0.0 /100 | #342 | Tragic 2.8% |
| Mexicans | 0.0 /100 | #343 | Tragic 2.7% |
| Spanish American Indians | 0.0 /100 | #344 | Tragic 2.7% |
| Immigrants | Mexico | 0.0 /100 | #345 | Tragic 2.6% |
| Lumbee | 0.0 /100 | #346 | Tragic 2.5% |
| Houma | 0.0 /100 | #347 | Tragic 2.2% |
Demographics Similar to Immigrants from Panama by Professional Degree
In terms of professional degree, the demographic groups most similar to Immigrants from Panama are Immigrants from Somalia (4.1%, a difference of 0.080%), Subsaharan African (4.1%, a difference of 0.16%), Immigrants from Nigeria (4.1%, a difference of 0.22%), German (4.1%, a difference of 0.26%), and Yugoslavian (4.1%, a difference of 0.40%).
| Demographics | Rating | Rank | Professional Degree |
| Immigrants | Iraq | 17.1 /100 | #202 | Poor 4.2% |
| Panamanians | 15.9 /100 | #203 | Poor 4.1% |
| Barbadians | 15.8 /100 | #204 | Poor 4.1% |
| Somalis | 14.8 /100 | #205 | Poor 4.1% |
| Yugoslavians | 13.4 /100 | #206 | Poor 4.1% |
| Sub-Saharan Africans | 12.8 /100 | #207 | Poor 4.1% |
| Immigrants | Somalia | 12.5 /100 | #208 | Poor 4.1% |
| Immigrants | Panama | 12.3 /100 | #209 | Poor 4.1% |
| Immigrants | Nigeria | 11.7 /100 | #210 | Poor 4.1% |
| Germans | 11.6 /100 | #211 | Poor 4.1% |
| Whites/Caucasians | 11.2 /100 | #212 | Poor 4.1% |
| Koreans | 10.7 /100 | #213 | Poor 4.1% |
| Immigrants | Ghana | 10.6 /100 | #214 | Poor 4.1% |
| Portuguese | 10.5 /100 | #215 | Poor 4.1% |
| West Indians | 9.8 /100 | #216 | Tragic 4.1% |