Cambodian vs Immigrants from Caribbean 1st Grade
COMPARE
Cambodian
Immigrants from Caribbean
1st Grade
1st Grade Comparison
Cambodians
Immigrants from Caribbean
98.1%
1ST GRADE
90.9/ 100
METRIC RATING
132nd/ 347
METRIC RANK
97.0%
1ST GRADE
0.0/ 100
METRIC RATING
302nd/ 347
METRIC RANK
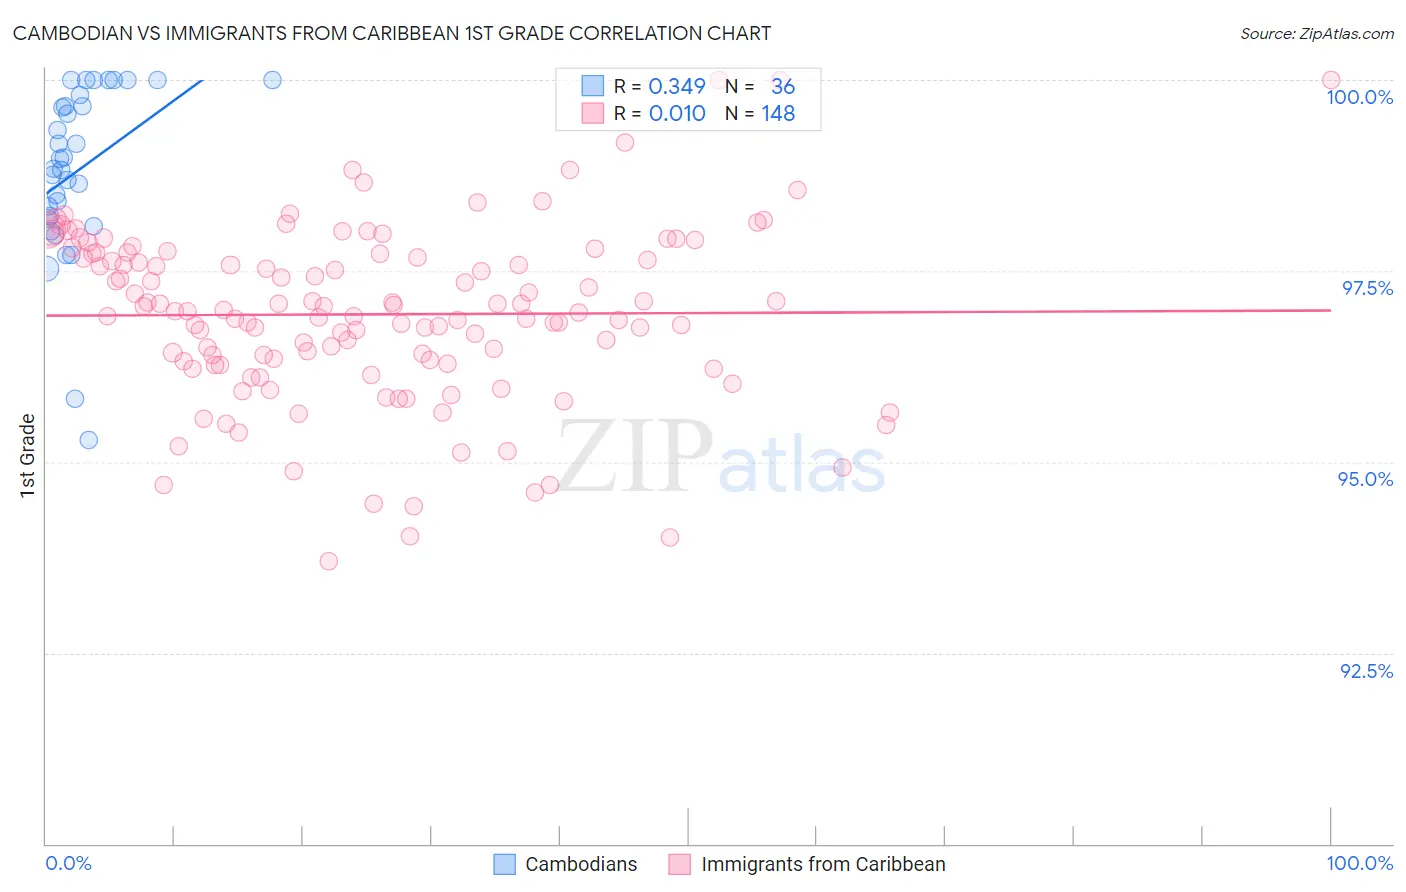
Cambodian vs Immigrants from Caribbean 1st Grade Correlation Chart
The statistical analysis conducted on geographies consisting of 102,511,743 people shows a mild positive correlation between the proportion of Cambodians and percentage of population with at least 1st grade education in the United States with a correlation coefficient (R) of 0.349 and weighted average of 98.1%. Similarly, the statistical analysis conducted on geographies consisting of 449,948,226 people shows no correlation between the proportion of Immigrants from Caribbean and percentage of population with at least 1st grade education in the United States with a correlation coefficient (R) of 0.010 and weighted average of 97.0%, a difference of 1.1%.
1st Grade Correlation Summary
| Measurement | Cambodian | Immigrants from Caribbean |
| Minimum | 95.3% | 93.7% |
| Maximum | 100.0% | 100.0% |
| Range | 4.7% | 6.3% |
| Mean | 98.8% | 96.9% |
| Median | 98.9% | 97.0% |
| Interquartile 25% (IQ1) | 98.2% | 96.3% |
| Interquartile 75% (IQ3) | 99.7% | 97.7% |
| Interquartile Range (IQR) | 1.5% | 1.4% |
| Standard Deviation (Sample) | 1.1% | 1.1% |
| Standard Deviation (Population) | 1.1% | 1.1% |
Similar Demographics by 1st Grade
Demographics Similar to Cambodians by 1st Grade
In terms of 1st grade, the demographic groups most similar to Cambodians are Spaniard (98.1%, a difference of 0.0%), Immigrants from Europe (98.1%, a difference of 0.0%), Immigrants from Serbia (98.1%, a difference of 0.010%), Seminole (98.1%, a difference of 0.010%), and Immigrants from Croatia (98.1%, a difference of 0.010%).
| Demographics | Rating | Rank | 1st Grade |
| Immigrants | Japan | 93.7 /100 | #125 | Exceptional 98.1% |
| Lebanese | 93.5 /100 | #126 | Exceptional 98.1% |
| Immigrants | Saudi Arabia | 93.3 /100 | #127 | Exceptional 98.1% |
| Immigrants | Serbia | 92.2 /100 | #128 | Exceptional 98.1% |
| Seminole | 91.9 /100 | #129 | Exceptional 98.1% |
| Immigrants | Croatia | 91.4 /100 | #130 | Exceptional 98.1% |
| Spaniards | 91.2 /100 | #131 | Exceptional 98.1% |
| Cambodians | 90.9 /100 | #132 | Exceptional 98.1% |
| Immigrants | Europe | 90.5 /100 | #133 | Exceptional 98.1% |
| Immigrants | Hungary | 89.4 /100 | #134 | Excellent 98.1% |
| Immigrants | Kuwait | 89.3 /100 | #135 | Excellent 98.1% |
| Immigrants | Bulgaria | 88.8 /100 | #136 | Excellent 98.1% |
| Israelis | 87.8 /100 | #137 | Excellent 98.1% |
| Immigrants | Romania | 87.8 /100 | #138 | Excellent 98.1% |
| Blackfeet | 87.6 /100 | #139 | Excellent 98.1% |
Demographics Similar to Immigrants from Caribbean by 1st Grade
In terms of 1st grade, the demographic groups most similar to Immigrants from Caribbean are Immigrants from South Eastern Asia (97.1%, a difference of 0.020%), Somali (97.0%, a difference of 0.030%), Haitian (97.1%, a difference of 0.050%), Nicaraguan (97.0%, a difference of 0.050%), and Ecuadorian (97.0%, a difference of 0.050%).
| Demographics | Rating | Rank | 1st Grade |
| Immigrants | Immigrants | 0.0 /100 | #295 | Tragic 97.2% |
| Immigrants | Eritrea | 0.0 /100 | #296 | Tragic 97.2% |
| Central American Indians | 0.0 /100 | #297 | Tragic 97.1% |
| Immigrants | Dominica | 0.0 /100 | #298 | Tragic 97.1% |
| Immigrants | Cuba | 0.0 /100 | #299 | Tragic 97.1% |
| Haitians | 0.0 /100 | #300 | Tragic 97.1% |
| Immigrants | South Eastern Asia | 0.0 /100 | #301 | Tragic 97.1% |
| Immigrants | Caribbean | 0.0 /100 | #302 | Tragic 97.0% |
| Somalis | 0.0 /100 | #303 | Tragic 97.0% |
| Nicaraguans | 0.0 /100 | #304 | Tragic 97.0% |
| Ecuadorians | 0.0 /100 | #305 | Tragic 97.0% |
| Belizeans | 0.0 /100 | #306 | Tragic 96.9% |
| Immigrants | Somalia | 0.0 /100 | #307 | Tragic 96.9% |
| Hispanics or Latinos | 0.0 /100 | #308 | Tragic 96.9% |
| Immigrants | Haiti | 0.0 /100 | #309 | Tragic 96.9% |