Houma vs Carpatho Rusyn 1st Grade
COMPARE
Houma
Carpatho Rusyn
1st Grade
1st Grade Comparison
Houma
Carpatho Rusyns
97.2%
1ST GRADE
0.0/ 100
METRIC RATING
291st/ 347
METRIC RANK
98.6%
1ST GRADE
100.0/ 100
METRIC RATING
13th/ 347
METRIC RANK
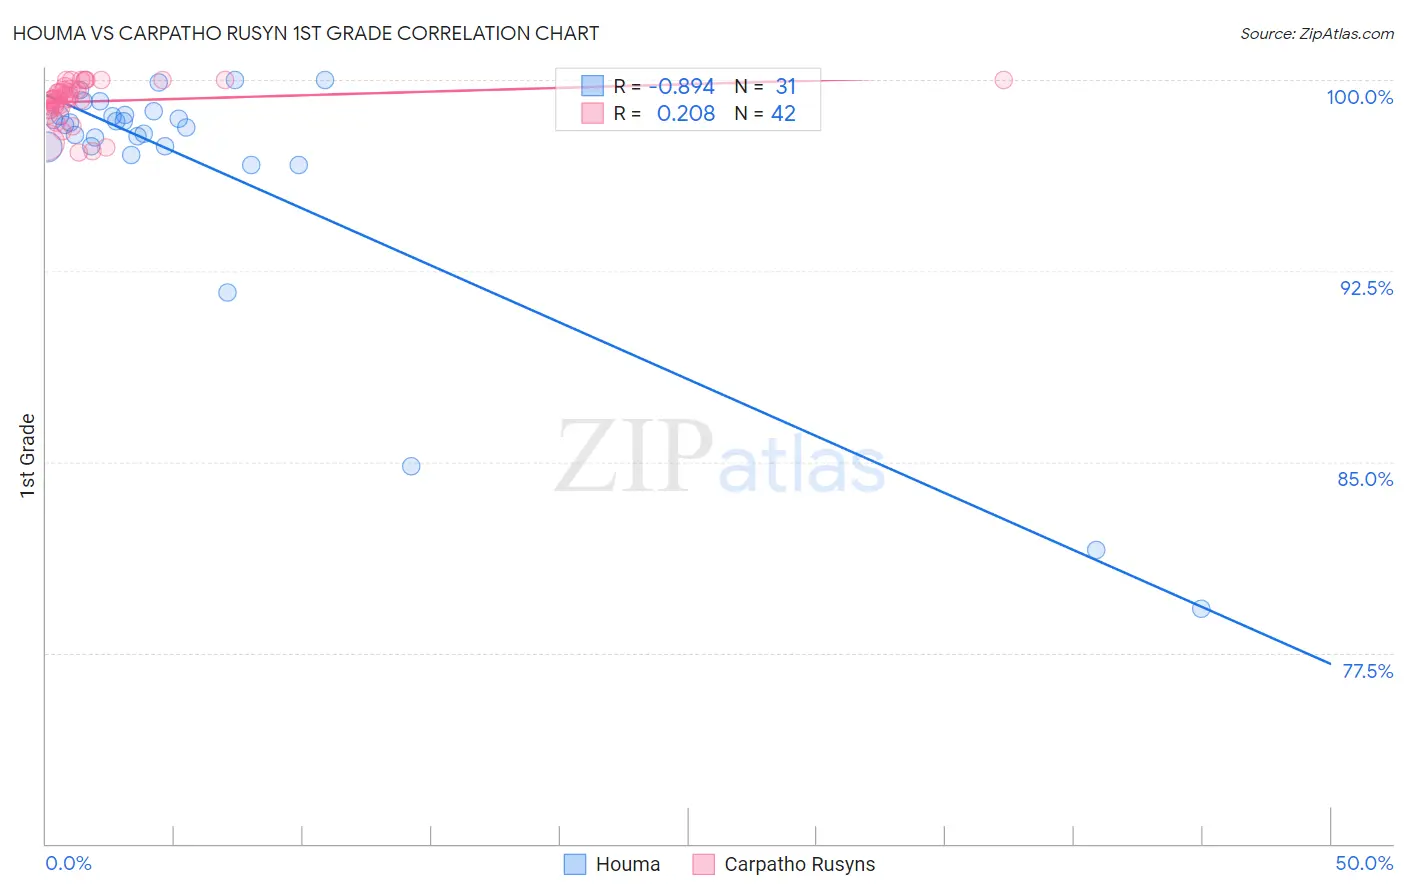
Houma vs Carpatho Rusyn 1st Grade Correlation Chart
The statistical analysis conducted on geographies consisting of 36,795,916 people shows a very strong negative correlation between the proportion of Houma and percentage of population with at least 1st grade education in the United States with a correlation coefficient (R) of -0.894 and weighted average of 97.2%. Similarly, the statistical analysis conducted on geographies consisting of 58,871,690 people shows a weak positive correlation between the proportion of Carpatho Rusyns and percentage of population with at least 1st grade education in the United States with a correlation coefficient (R) of 0.208 and weighted average of 98.6%, a difference of 1.5%.
1st Grade Correlation Summary
| Measurement | Houma | Carpatho Rusyn |
| Minimum | 79.2% | 97.2% |
| Maximum | 100.0% | 100.0% |
| Range | 20.8% | 2.8% |
| Mean | 96.5% | 99.2% |
| Median | 98.2% | 99.3% |
| Interquartile 25% (IQ1) | 97.4% | 98.9% |
| Interquartile 75% (IQ3) | 98.6% | 99.8% |
| Interquartile Range (IQR) | 1.2% | 0.86% |
| Standard Deviation (Sample) | 5.1% | 0.80% |
| Standard Deviation (Population) | 5.1% | 0.79% |
Similar Demographics by 1st Grade
Demographics Similar to Houma by 1st Grade
In terms of 1st grade, the demographic groups most similar to Houma are Immigrants from Afghanistan (97.3%, a difference of 0.020%), Immigrants from St. Vincent and the Grenadines (97.3%, a difference of 0.020%), British West Indian (97.2%, a difference of 0.020%), Immigrants from Hong Kong (97.3%, a difference of 0.040%), and Immigrants from Thailand (97.3%, a difference of 0.040%).
| Demographics | Rating | Rank | 1st Grade |
| Immigrants | Trinidad and Tobago | 0.0 /100 | #284 | Tragic 97.3% |
| Immigrants | Portugal | 0.0 /100 | #285 | Tragic 97.3% |
| Immigrants | Barbados | 0.0 /100 | #286 | Tragic 97.3% |
| Immigrants | Hong Kong | 0.0 /100 | #287 | Tragic 97.3% |
| Immigrants | Thailand | 0.0 /100 | #288 | Tragic 97.3% |
| Immigrants | Afghanistan | 0.0 /100 | #289 | Tragic 97.3% |
| Immigrants | St. Vincent and the Grenadines | 0.0 /100 | #290 | Tragic 97.3% |
| Houma | 0.0 /100 | #291 | Tragic 97.2% |
| British West Indians | 0.0 /100 | #292 | Tragic 97.2% |
| Malaysians | 0.0 /100 | #293 | Tragic 97.2% |
| Immigrants | Grenada | 0.0 /100 | #294 | Tragic 97.2% |
| Immigrants | Immigrants | 0.0 /100 | #295 | Tragic 97.2% |
| Immigrants | Eritrea | 0.0 /100 | #296 | Tragic 97.2% |
| Central American Indians | 0.0 /100 | #297 | Tragic 97.1% |
| Immigrants | Dominica | 0.0 /100 | #298 | Tragic 97.1% |
Demographics Similar to Carpatho Rusyns by 1st Grade
In terms of 1st grade, the demographic groups most similar to Carpatho Rusyns are English (98.6%, a difference of 0.0%), Slovene (98.7%, a difference of 0.010%), Swedish (98.6%, a difference of 0.010%), Tlingit-Haida (98.7%, a difference of 0.020%), and Aleut (98.6%, a difference of 0.030%).
| Demographics | Rating | Rank | 1st Grade |
| Alaskan Athabascans | 100.0 /100 | #6 | Exceptional 98.8% |
| Alaska Natives | 100.0 /100 | #7 | Exceptional 98.7% |
| Norwegians | 100.0 /100 | #8 | Exceptional 98.7% |
| Slovaks | 100.0 /100 | #9 | Exceptional 98.7% |
| Germans | 100.0 /100 | #10 | Exceptional 98.7% |
| Tlingit-Haida | 100.0 /100 | #11 | Exceptional 98.7% |
| Slovenes | 100.0 /100 | #12 | Exceptional 98.7% |
| Carpatho Rusyns | 100.0 /100 | #13 | Exceptional 98.6% |
| English | 100.0 /100 | #14 | Exceptional 98.6% |
| Swedes | 100.0 /100 | #15 | Exceptional 98.6% |
| Aleuts | 100.0 /100 | #16 | Exceptional 98.6% |
| Scottish | 100.0 /100 | #17 | Exceptional 98.6% |
| Dutch | 100.0 /100 | #18 | Exceptional 98.6% |
| Irish | 100.0 /100 | #19 | Exceptional 98.6% |
| Sioux | 100.0 /100 | #20 | Exceptional 98.6% |