Hopi vs Estonian No Schooling Completed
COMPARE
Hopi
Estonian
No Schooling Completed
No Schooling Completed Comparison
Hopi
Estonians
2.2%
NO SCHOOLING COMPLETED
12.9/ 100
METRIC RATING
204th/ 347
METRIC RANK
1.6%
NO SCHOOLING COMPLETED
99.9/ 100
METRIC RATING
44th/ 347
METRIC RANK
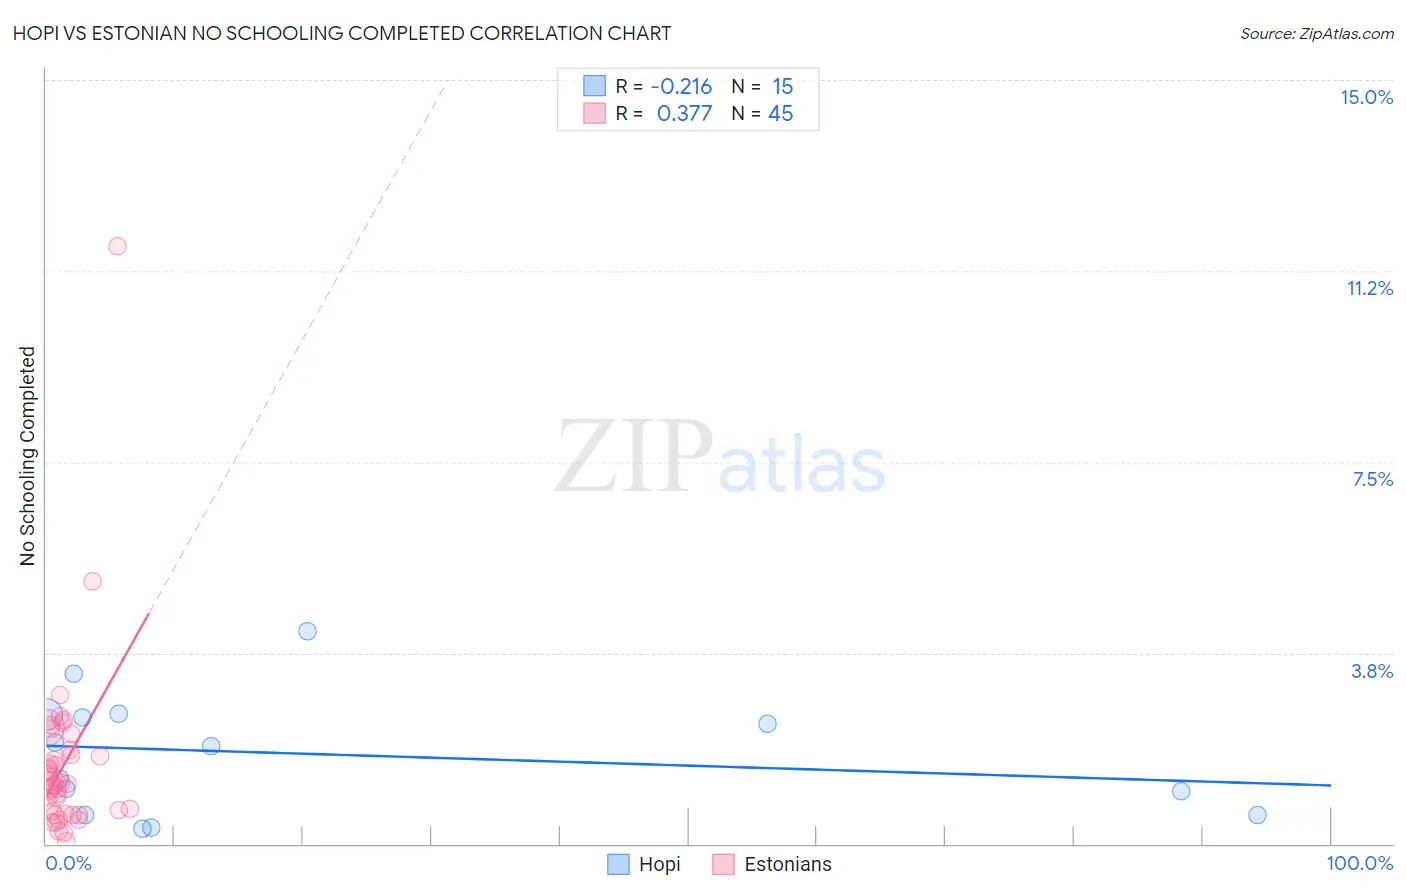
Hopi vs Estonian No Schooling Completed Correlation Chart
The statistical analysis conducted on geographies consisting of 74,568,063 people shows a weak negative correlation between the proportion of Hopi and percentage of population with no schooling in the United States with a correlation coefficient (R) of -0.216 and weighted average of 2.2%. Similarly, the statistical analysis conducted on geographies consisting of 123,023,374 people shows a mild positive correlation between the proportion of Estonians and percentage of population with no schooling in the United States with a correlation coefficient (R) of 0.377 and weighted average of 1.6%, a difference of 37.3%.
No Schooling Completed Correlation Summary
| Measurement | Hopi | Estonian |
| Minimum | 0.29% | 0.039% |
| Maximum | 4.2% | 11.7% |
| Range | 3.9% | 11.7% |
| Mean | 1.8% | 1.6% |
| Median | 1.9% | 1.2% |
| Interquartile 25% (IQ1) | 0.57% | 0.62% |
| Interquartile 75% (IQ3) | 2.5% | 1.8% |
| Interquartile Range (IQR) | 2.0% | 1.2% |
| Standard Deviation (Sample) | 1.2% | 1.8% |
| Standard Deviation (Population) | 1.1% | 1.8% |
Similar Demographics by No Schooling Completed
Demographics Similar to Hopi by No Schooling Completed
In terms of no schooling completed, the demographic groups most similar to Hopi are Laotian (2.2%, a difference of 0.11%), Moroccan (2.2%, a difference of 0.22%), Immigrants from Bahamas (2.2%, a difference of 0.40%), Bahamian (2.2%, a difference of 0.41%), and South American Indian (2.2%, a difference of 0.59%).
| Demographics | Rating | Rank | No Schooling Completed |
| Immigrants | Southern Europe | 23.8 /100 | #197 | Fair 2.2% |
| Immigrants | Chile | 22.7 /100 | #198 | Fair 2.2% |
| Africans | 21.8 /100 | #199 | Fair 2.2% |
| Immigrants | Northern Africa | 19.5 /100 | #200 | Poor 2.2% |
| Costa Ricans | 17.1 /100 | #201 | Poor 2.2% |
| Moroccans | 13.7 /100 | #202 | Poor 2.2% |
| Laotians | 13.3 /100 | #203 | Poor 2.2% |
| Hopi | 12.9 /100 | #204 | Poor 2.2% |
| Immigrants | Bahamas | 11.6 /100 | #205 | Poor 2.2% |
| Bahamians | 11.6 /100 | #206 | Poor 2.2% |
| South American Indians | 11.0 /100 | #207 | Poor 2.2% |
| Uruguayans | 11.0 /100 | #208 | Poor 2.2% |
| Immigrants | Oceania | 10.2 /100 | #209 | Poor 2.2% |
| Natives/Alaskans | 10.0 /100 | #210 | Tragic 2.2% |
| Immigrants | Panama | 8.8 /100 | #211 | Tragic 2.3% |
Demographics Similar to Estonians by No Schooling Completed
In terms of no schooling completed, the demographic groups most similar to Estonians are Czechoslovakian (1.6%, a difference of 0.040%), Maltese (1.6%, a difference of 0.13%), Australian (1.6%, a difference of 0.19%), Ottawa (1.6%, a difference of 0.27%), and Bulgarian (1.6%, a difference of 0.31%).
| Demographics | Rating | Rank | No Schooling Completed |
| Belgians | 99.9 /100 | #37 | Exceptional 1.6% |
| Northern Europeans | 99.9 /100 | #38 | Exceptional 1.6% |
| Native Hawaiians | 99.9 /100 | #39 | Exceptional 1.6% |
| Luxembourgers | 99.9 /100 | #40 | Exceptional 1.6% |
| Hungarians | 99.9 /100 | #41 | Exceptional 1.6% |
| Bulgarians | 99.9 /100 | #42 | Exceptional 1.6% |
| Australians | 99.9 /100 | #43 | Exceptional 1.6% |
| Estonians | 99.9 /100 | #44 | Exceptional 1.6% |
| Czechoslovakians | 99.9 /100 | #45 | Exceptional 1.6% |
| Maltese | 99.9 /100 | #46 | Exceptional 1.6% |
| Ottawa | 99.9 /100 | #47 | Exceptional 1.6% |
| Immigrants | Scotland | 99.9 /100 | #48 | Exceptional 1.6% |
| Whites/Caucasians | 99.9 /100 | #49 | Exceptional 1.6% |
| Celtics | 99.9 /100 | #50 | Exceptional 1.6% |
| Chippewa | 99.8 /100 | #51 | Exceptional 1.6% |