Hopi vs Immigrants from Congo No Schooling Completed
COMPARE
Hopi
Immigrants from Congo
No Schooling Completed
No Schooling Completed Comparison
Hopi
Immigrants from Congo
2.2%
NO SCHOOLING COMPLETED
12.9/ 100
METRIC RATING
204th/ 347
METRIC RANK
2.4%
NO SCHOOLING COMPLETED
1.4/ 100
METRIC RATING
246th/ 347
METRIC RANK
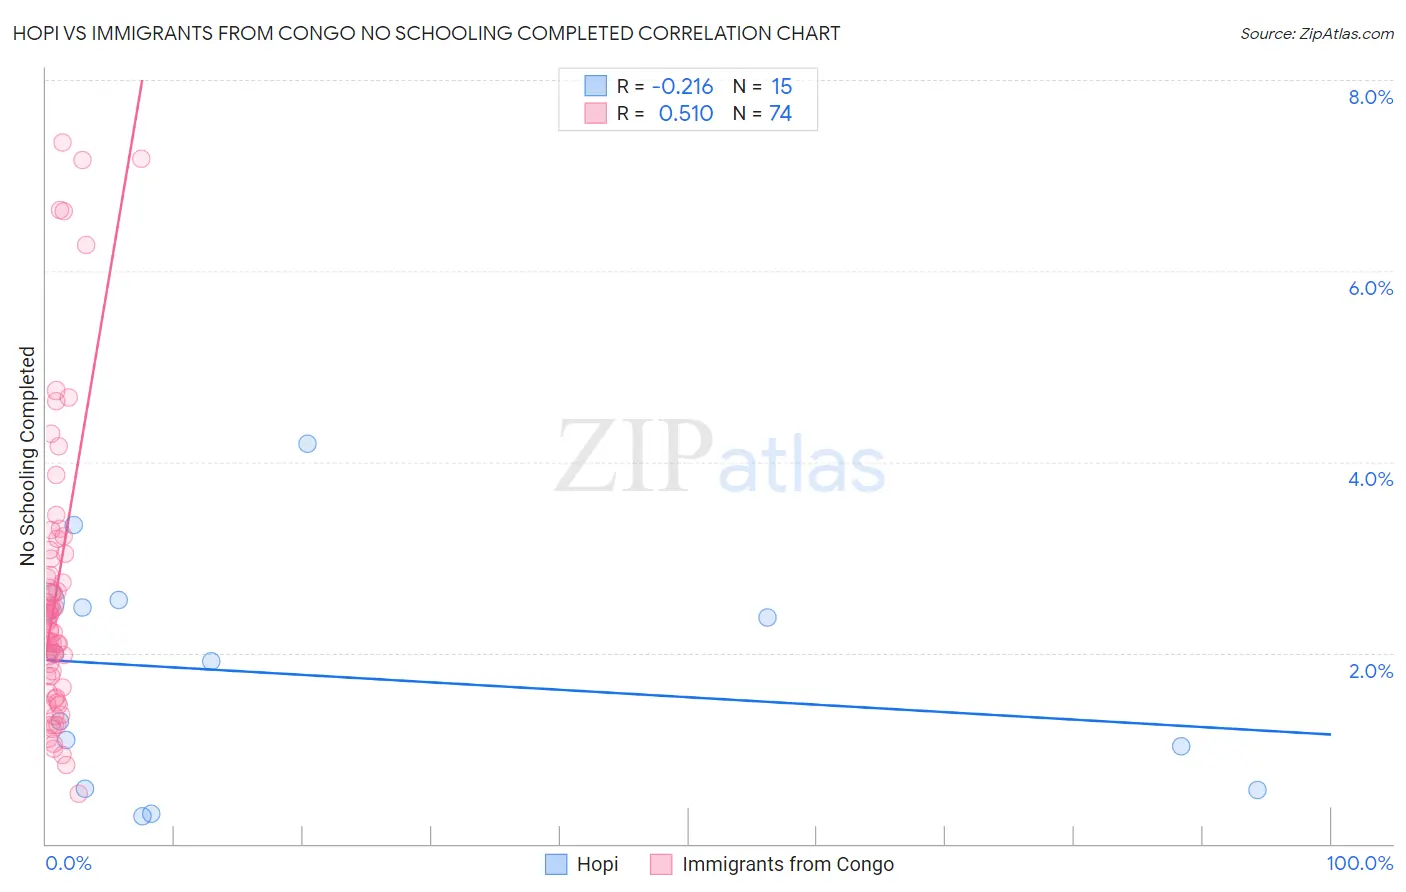
Hopi vs Immigrants from Congo No Schooling Completed Correlation Chart
The statistical analysis conducted on geographies consisting of 74,568,063 people shows a weak negative correlation between the proportion of Hopi and percentage of population with no schooling in the United States with a correlation coefficient (R) of -0.216 and weighted average of 2.2%. Similarly, the statistical analysis conducted on geographies consisting of 91,959,096 people shows a substantial positive correlation between the proportion of Immigrants from Congo and percentage of population with no schooling in the United States with a correlation coefficient (R) of 0.510 and weighted average of 2.4%, a difference of 7.4%.
No Schooling Completed Correlation Summary
| Measurement | Hopi | Immigrants from Congo |
| Minimum | 0.29% | 0.52% |
| Maximum | 4.2% | 7.4% |
| Range | 3.9% | 6.8% |
| Mean | 1.8% | 2.7% |
| Median | 1.9% | 2.3% |
| Interquartile 25% (IQ1) | 0.57% | 1.6% |
| Interquartile 75% (IQ3) | 2.5% | 3.0% |
| Interquartile Range (IQR) | 2.0% | 1.4% |
| Standard Deviation (Sample) | 1.2% | 1.6% |
| Standard Deviation (Population) | 1.1% | 1.5% |
Similar Demographics by No Schooling Completed
Demographics Similar to Hopi by No Schooling Completed
In terms of no schooling completed, the demographic groups most similar to Hopi are Laotian (2.2%, a difference of 0.11%), Moroccan (2.2%, a difference of 0.22%), Immigrants from Bahamas (2.2%, a difference of 0.40%), Bahamian (2.2%, a difference of 0.41%), and South American Indian (2.2%, a difference of 0.59%).
| Demographics | Rating | Rank | No Schooling Completed |
| Immigrants | Southern Europe | 23.8 /100 | #197 | Fair 2.2% |
| Immigrants | Chile | 22.7 /100 | #198 | Fair 2.2% |
| Africans | 21.8 /100 | #199 | Fair 2.2% |
| Immigrants | Northern Africa | 19.5 /100 | #200 | Poor 2.2% |
| Costa Ricans | 17.1 /100 | #201 | Poor 2.2% |
| Moroccans | 13.7 /100 | #202 | Poor 2.2% |
| Laotians | 13.3 /100 | #203 | Poor 2.2% |
| Hopi | 12.9 /100 | #204 | Poor 2.2% |
| Immigrants | Bahamas | 11.6 /100 | #205 | Poor 2.2% |
| Bahamians | 11.6 /100 | #206 | Poor 2.2% |
| South American Indians | 11.0 /100 | #207 | Poor 2.2% |
| Uruguayans | 11.0 /100 | #208 | Poor 2.2% |
| Immigrants | Oceania | 10.2 /100 | #209 | Poor 2.2% |
| Natives/Alaskans | 10.0 /100 | #210 | Tragic 2.2% |
| Immigrants | Panama | 8.8 /100 | #211 | Tragic 2.3% |
Demographics Similar to Immigrants from Congo by No Schooling Completed
In terms of no schooling completed, the demographic groups most similar to Immigrants from Congo are Peruvian (2.4%, a difference of 0.050%), Bolivian (2.4%, a difference of 0.050%), Immigrants from Iraq (2.4%, a difference of 0.11%), South American (2.4%, a difference of 0.16%), and Immigrants from Indonesia (2.4%, a difference of 0.20%).
| Demographics | Rating | Rank | No Schooling Completed |
| Liberians | 1.8 /100 | #239 | Tragic 2.4% |
| Immigrants | Senegal | 1.7 /100 | #240 | Tragic 2.4% |
| Koreans | 1.7 /100 | #241 | Tragic 2.4% |
| Immigrants | Indonesia | 1.5 /100 | #242 | Tragic 2.4% |
| South Americans | 1.5 /100 | #243 | Tragic 2.4% |
| Peruvians | 1.4 /100 | #244 | Tragic 2.4% |
| Bolivians | 1.4 /100 | #245 | Tragic 2.4% |
| Immigrants | Congo | 1.4 /100 | #246 | Tragic 2.4% |
| Immigrants | Iraq | 1.3 /100 | #247 | Tragic 2.4% |
| Asians | 1.2 /100 | #248 | Tragic 2.4% |
| Jamaicans | 1.2 /100 | #249 | Tragic 2.4% |
| Immigrants | Middle Africa | 1.1 /100 | #250 | Tragic 2.4% |
| Immigrants | Africa | 1.1 /100 | #251 | Tragic 2.4% |
| Immigrants | Colombia | 1.0 /100 | #252 | Tragic 2.4% |
| Immigrants | Asia | 0.9 /100 | #253 | Tragic 2.4% |