Hopi vs Immigrants from Sweden College, 1 year or more
COMPARE
Hopi
Immigrants from Sweden
College, 1 year or more
College, 1 year or more Comparison
Hopi
Immigrants from Sweden
50.9%
COLLEGE, 1 YEAR OR MORE
0.0/ 100
METRIC RATING
321st/ 347
METRIC RANK
66.8%
COLLEGE, 1 YEAR OR MORE
100.0/ 100
METRIC RATING
13th/ 347
METRIC RANK
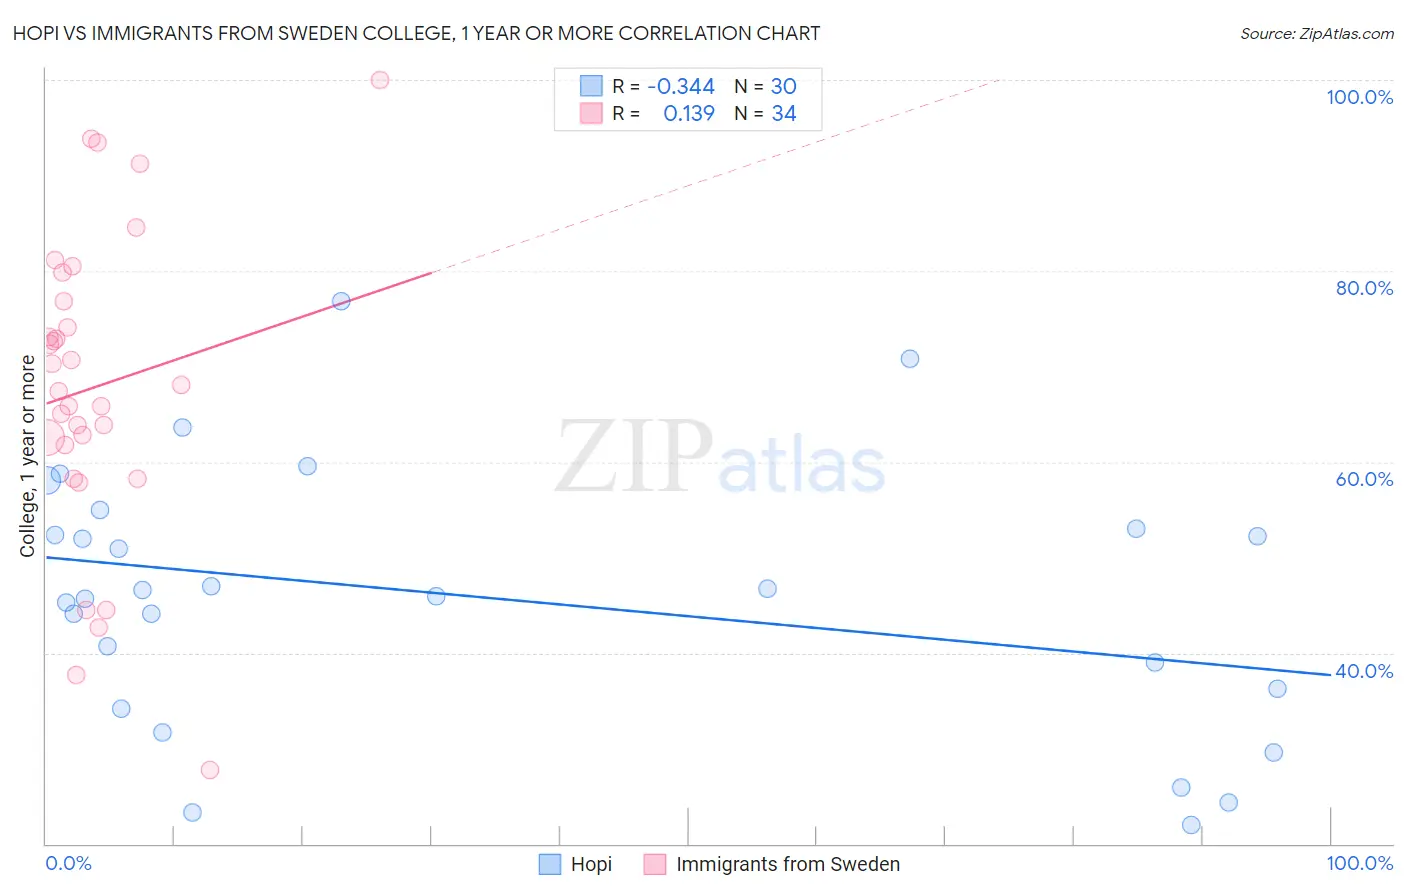
Hopi vs Immigrants from Sweden College, 1 year or more Correlation Chart
The statistical analysis conducted on geographies consisting of 74,740,168 people shows a mild negative correlation between the proportion of Hopi and percentage of population with at least college, 1 year or more education in the United States with a correlation coefficient (R) of -0.344 and weighted average of 50.9%. Similarly, the statistical analysis conducted on geographies consisting of 164,737,293 people shows a poor positive correlation between the proportion of Immigrants from Sweden and percentage of population with at least college, 1 year or more education in the United States with a correlation coefficient (R) of 0.139 and weighted average of 66.8%, a difference of 31.3%.
College, 1 year or more Correlation Summary
| Measurement | Hopi | Immigrants from Sweden |
| Minimum | 21.9% | 27.7% |
| Maximum | 76.9% | 100.0% |
| Range | 55.0% | 72.3% |
| Mean | 45.8% | 67.8% |
| Median | 46.2% | 67.8% |
| Interquartile 25% (IQ1) | 36.2% | 61.7% |
| Interquartile 75% (IQ3) | 53.0% | 76.8% |
| Interquartile Range (IQR) | 16.9% | 15.1% |
| Standard Deviation (Sample) | 13.7% | 16.1% |
| Standard Deviation (Population) | 13.4% | 15.9% |
Similar Demographics by College, 1 year or more
Demographics Similar to Hopi by College, 1 year or more
In terms of college, 1 year or more, the demographic groups most similar to Hopi are Kiowa (51.0%, a difference of 0.12%), Navajo (50.8%, a difference of 0.18%), Immigrants from El Salvador (51.0%, a difference of 0.19%), Immigrants from Honduras (51.0%, a difference of 0.27%), and Hispanic or Latino (51.1%, a difference of 0.40%).
| Demographics | Rating | Rank | College, 1 year or more |
| Fijians | 0.0 /100 | #314 | Tragic 51.3% |
| Guatemalans | 0.0 /100 | #315 | Tragic 51.2% |
| Cajuns | 0.0 /100 | #316 | Tragic 51.2% |
| Hispanics or Latinos | 0.0 /100 | #317 | Tragic 51.1% |
| Immigrants | Honduras | 0.0 /100 | #318 | Tragic 51.0% |
| Immigrants | El Salvador | 0.0 /100 | #319 | Tragic 51.0% |
| Kiowa | 0.0 /100 | #320 | Tragic 51.0% |
| Hopi | 0.0 /100 | #321 | Tragic 50.9% |
| Navajo | 0.0 /100 | #322 | Tragic 50.8% |
| Immigrants | Guatemala | 0.0 /100 | #323 | Tragic 50.7% |
| Immigrants | Cuba | 0.0 /100 | #324 | Tragic 50.7% |
| Immigrants | Latin America | 0.0 /100 | #325 | Tragic 50.7% |
| Dominicans | 0.0 /100 | #326 | Tragic 50.6% |
| Menominee | 0.0 /100 | #327 | Tragic 50.6% |
| Dutch West Indians | 0.0 /100 | #328 | Tragic 50.5% |
Demographics Similar to Immigrants from Sweden by College, 1 year or more
In terms of college, 1 year or more, the demographic groups most similar to Immigrants from Sweden are Burmese (66.7%, a difference of 0.19%), Cambodian (66.7%, a difference of 0.19%), Immigrants from Japan (66.7%, a difference of 0.23%), Cypriot (67.0%, a difference of 0.31%), and Immigrants from Eastern Asia (66.6%, a difference of 0.34%).
| Demographics | Rating | Rank | College, 1 year or more |
| Immigrants | Iran | 100.0 /100 | #6 | Exceptional 69.5% |
| Okinawans | 100.0 /100 | #7 | Exceptional 69.0% |
| Thais | 100.0 /100 | #8 | Exceptional 68.6% |
| Immigrants | Israel | 100.0 /100 | #9 | Exceptional 67.8% |
| Immigrants | Australia | 100.0 /100 | #10 | Exceptional 67.7% |
| Immigrants | South Central Asia | 100.0 /100 | #11 | Exceptional 67.1% |
| Cypriots | 100.0 /100 | #12 | Exceptional 67.0% |
| Immigrants | Sweden | 100.0 /100 | #13 | Exceptional 66.8% |
| Burmese | 100.0 /100 | #14 | Exceptional 66.7% |
| Cambodians | 100.0 /100 | #15 | Exceptional 66.7% |
| Immigrants | Japan | 100.0 /100 | #16 | Exceptional 66.7% |
| Immigrants | Eastern Asia | 100.0 /100 | #17 | Exceptional 66.6% |
| Eastern Europeans | 100.0 /100 | #18 | Exceptional 66.6% |
| Immigrants | Switzerland | 100.0 /100 | #19 | Exceptional 66.5% |
| Immigrants | Korea | 100.0 /100 | #20 | Exceptional 66.5% |