Hopi vs Immigrants from Eastern Europe College, 1 year or more
COMPARE
Hopi
Immigrants from Eastern Europe
College, 1 year or more
College, 1 year or more Comparison
Hopi
Immigrants from Eastern Europe
50.9%
COLLEGE, 1 YEAR OR MORE
0.0/ 100
METRIC RATING
321st/ 347
METRIC RANK
62.4%
COLLEGE, 1 YEAR OR MORE
97.8/ 100
METRIC RATING
91st/ 347
METRIC RANK
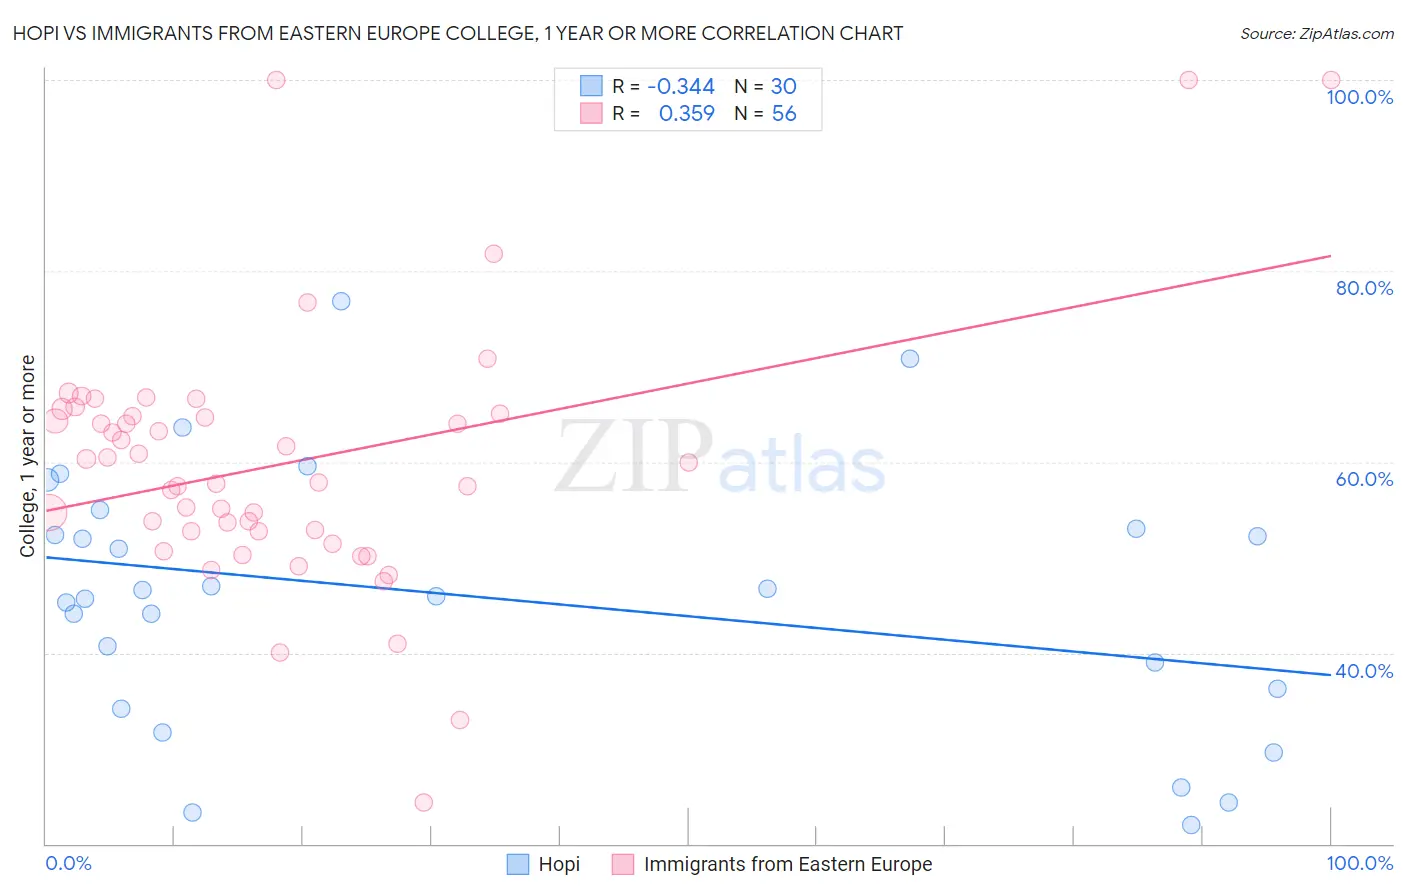
Hopi vs Immigrants from Eastern Europe College, 1 year or more Correlation Chart
The statistical analysis conducted on geographies consisting of 74,740,168 people shows a mild negative correlation between the proportion of Hopi and percentage of population with at least college, 1 year or more education in the United States with a correlation coefficient (R) of -0.344 and weighted average of 50.9%. Similarly, the statistical analysis conducted on geographies consisting of 475,874,060 people shows a mild positive correlation between the proportion of Immigrants from Eastern Europe and percentage of population with at least college, 1 year or more education in the United States with a correlation coefficient (R) of 0.359 and weighted average of 62.4%, a difference of 22.6%.
College, 1 year or more Correlation Summary
| Measurement | Hopi | Immigrants from Eastern Europe |
| Minimum | 21.9% | 24.4% |
| Maximum | 76.9% | 100.0% |
| Range | 55.0% | 75.6% |
| Mean | 45.8% | 59.8% |
| Median | 46.2% | 58.9% |
| Interquartile 25% (IQ1) | 36.2% | 52.7% |
| Interquartile 75% (IQ3) | 53.0% | 64.9% |
| Interquartile Range (IQR) | 16.9% | 12.2% |
| Standard Deviation (Sample) | 13.7% | 13.7% |
| Standard Deviation (Population) | 13.4% | 13.6% |
Similar Demographics by College, 1 year or more
Demographics Similar to Hopi by College, 1 year or more
In terms of college, 1 year or more, the demographic groups most similar to Hopi are Kiowa (51.0%, a difference of 0.12%), Navajo (50.8%, a difference of 0.18%), Immigrants from El Salvador (51.0%, a difference of 0.19%), Immigrants from Honduras (51.0%, a difference of 0.27%), and Hispanic or Latino (51.1%, a difference of 0.40%).
| Demographics | Rating | Rank | College, 1 year or more |
| Fijians | 0.0 /100 | #314 | Tragic 51.3% |
| Guatemalans | 0.0 /100 | #315 | Tragic 51.2% |
| Cajuns | 0.0 /100 | #316 | Tragic 51.2% |
| Hispanics or Latinos | 0.0 /100 | #317 | Tragic 51.1% |
| Immigrants | Honduras | 0.0 /100 | #318 | Tragic 51.0% |
| Immigrants | El Salvador | 0.0 /100 | #319 | Tragic 51.0% |
| Kiowa | 0.0 /100 | #320 | Tragic 51.0% |
| Hopi | 0.0 /100 | #321 | Tragic 50.9% |
| Navajo | 0.0 /100 | #322 | Tragic 50.8% |
| Immigrants | Guatemala | 0.0 /100 | #323 | Tragic 50.7% |
| Immigrants | Cuba | 0.0 /100 | #324 | Tragic 50.7% |
| Immigrants | Latin America | 0.0 /100 | #325 | Tragic 50.7% |
| Dominicans | 0.0 /100 | #326 | Tragic 50.6% |
| Menominee | 0.0 /100 | #327 | Tragic 50.6% |
| Dutch West Indians | 0.0 /100 | #328 | Tragic 50.5% |
Demographics Similar to Immigrants from Eastern Europe by College, 1 year or more
In terms of college, 1 year or more, the demographic groups most similar to Immigrants from Eastern Europe are Immigrants from Egypt (62.4%, a difference of 0.010%), Romanian (62.4%, a difference of 0.040%), Immigrants from Croatia (62.3%, a difference of 0.090%), Immigrants from Western Asia (62.5%, a difference of 0.10%), and British (62.3%, a difference of 0.20%).
| Demographics | Rating | Rank | College, 1 year or more |
| Immigrants | England | 98.6 /100 | #84 | Exceptional 62.8% |
| Immigrants | Pakistan | 98.6 /100 | #85 | Exceptional 62.8% |
| Immigrants | Western Europe | 98.6 /100 | #86 | Exceptional 62.7% |
| Immigrants | Hungary | 98.6 /100 | #87 | Exceptional 62.7% |
| Greeks | 98.3 /100 | #88 | Exceptional 62.6% |
| Immigrants | Ethiopia | 98.2 /100 | #89 | Exceptional 62.6% |
| Immigrants | Western Asia | 97.9 /100 | #90 | Exceptional 62.5% |
| Immigrants | Eastern Europe | 97.8 /100 | #91 | Exceptional 62.4% |
| Immigrants | Egypt | 97.8 /100 | #92 | Exceptional 62.4% |
| Romanians | 97.7 /100 | #93 | Exceptional 62.4% |
| Immigrants | Croatia | 97.6 /100 | #94 | Exceptional 62.3% |
| British | 97.4 /100 | #95 | Exceptional 62.3% |
| Chinese | 97.2 /100 | #96 | Exceptional 62.2% |
| Jordanians | 97.2 /100 | #97 | Exceptional 62.2% |
| Carpatho Rusyns | 97.2 /100 | #98 | Exceptional 62.2% |