Honduran vs Cajun College, Under 1 year
COMPARE
Honduran
Cajun
College, Under 1 year
College, Under 1 year Comparison
Hondurans
Cajuns
57.1%
COLLEGE, UNDER 1 YEAR
0.0/ 100
METRIC RATING
315th/ 347
METRIC RANK
57.3%
COLLEGE, UNDER 1 YEAR
0.0/ 100
METRIC RATING
311th/ 347
METRIC RANK
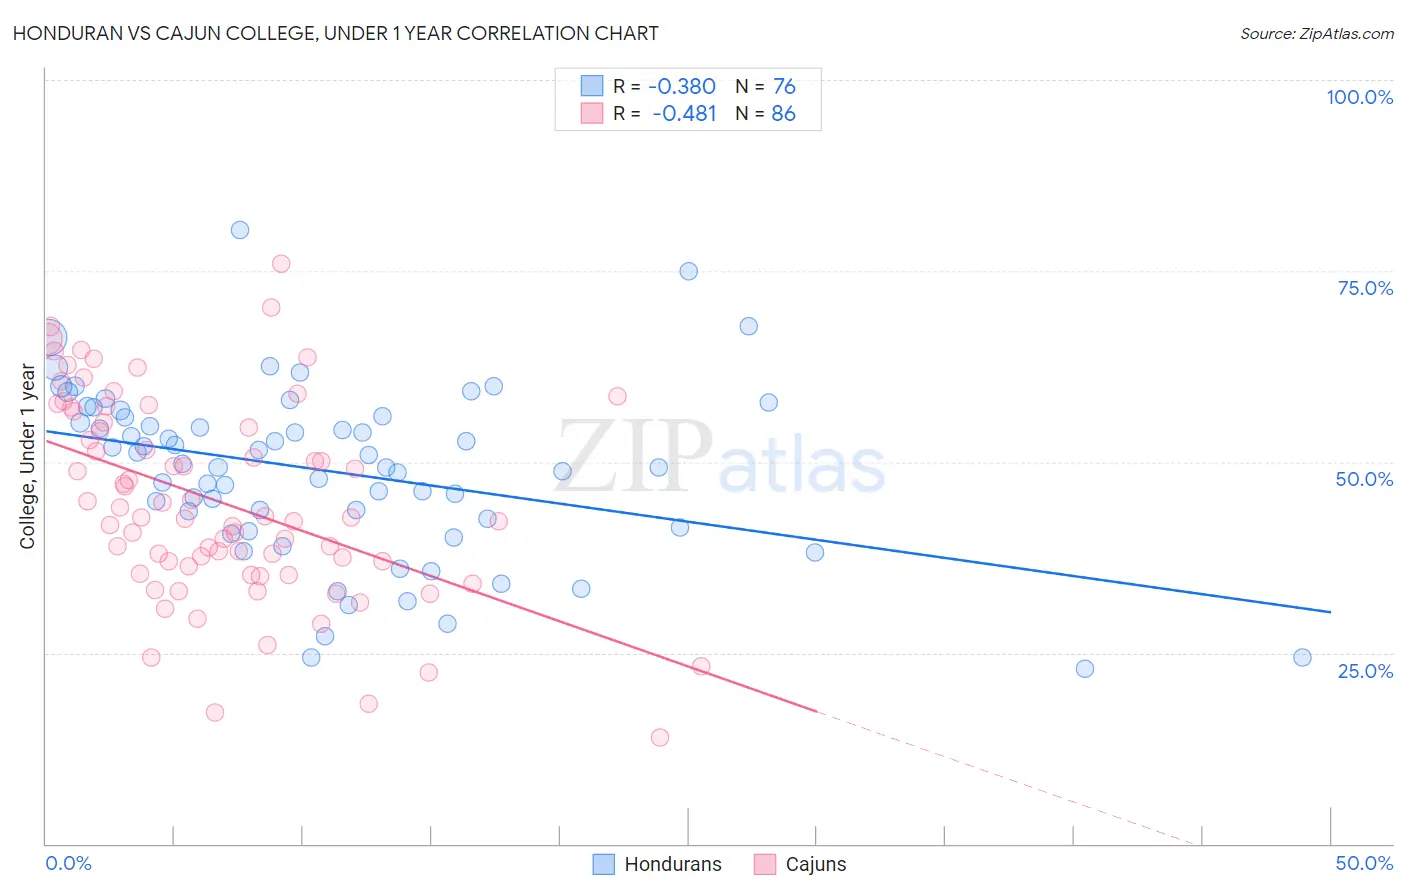
Honduran vs Cajun College, Under 1 year Correlation Chart
The statistical analysis conducted on geographies consisting of 357,856,249 people shows a mild negative correlation between the proportion of Hondurans and percentage of population with at least college, under 1 year education in the United States with a correlation coefficient (R) of -0.380 and weighted average of 57.1%. Similarly, the statistical analysis conducted on geographies consisting of 149,713,149 people shows a moderate negative correlation between the proportion of Cajuns and percentage of population with at least college, under 1 year education in the United States with a correlation coefficient (R) of -0.481 and weighted average of 57.3%, a difference of 0.47%.
College, Under 1 year Correlation Summary
| Measurement | Honduran | Cajun |
| Minimum | 22.9% | 13.9% |
| Maximum | 80.4% | 75.9% |
| Range | 57.4% | 62.0% |
| Mean | 48.8% | 44.8% |
| Median | 49.5% | 42.7% |
| Interquartile 25% (IQ1) | 41.9% | 36.3% |
| Interquartile 75% (IQ3) | 55.9% | 55.2% |
| Interquartile Range (IQR) | 14.0% | 18.9% |
| Standard Deviation (Sample) | 11.3% | 13.0% |
| Standard Deviation (Population) | 11.2% | 12.9% |
Demographics Similar to Hondurans and Cajuns by College, Under 1 year
In terms of college, under 1 year, the demographic groups most similar to Hondurans are Hopi (57.1%, a difference of 0.040%), Menominee (57.0%, a difference of 0.050%), Hispanic or Latino (57.0%, a difference of 0.090%), Dutch West Indian (57.2%, a difference of 0.16%), and Immigrants from Haiti (56.9%, a difference of 0.21%). Similarly, the demographic groups most similar to Cajuns are Pueblo (57.4%, a difference of 0.060%), Salvadoran (57.3%, a difference of 0.070%), Dutch West Indian (57.2%, a difference of 0.31%), Hopi (57.1%, a difference of 0.42%), and Immigrants from Nicaragua (57.6%, a difference of 0.45%).
| Demographics | Rating | Rank | College, Under 1 year |
| Immigrants | Dominica | 0.0 /100 | #303 | Tragic 57.9% |
| Kiowa | 0.0 /100 | #304 | Tragic 57.8% |
| Haitians | 0.0 /100 | #305 | Tragic 57.8% |
| Immigrants | Portugal | 0.0 /100 | #306 | Tragic 57.7% |
| Fijians | 0.0 /100 | #307 | Tragic 57.7% |
| Central Americans | 0.0 /100 | #308 | Tragic 57.7% |
| Immigrants | Nicaragua | 0.0 /100 | #309 | Tragic 57.6% |
| Pueblo | 0.0 /100 | #310 | Tragic 57.4% |
| Cajuns | 0.0 /100 | #311 | Tragic 57.3% |
| Salvadorans | 0.0 /100 | #312 | Tragic 57.3% |
| Dutch West Indians | 0.0 /100 | #313 | Tragic 57.2% |
| Hopi | 0.0 /100 | #314 | Tragic 57.1% |
| Hondurans | 0.0 /100 | #315 | Tragic 57.1% |
| Menominee | 0.0 /100 | #316 | Tragic 57.0% |
| Hispanics or Latinos | 0.0 /100 | #317 | Tragic 57.0% |
| Immigrants | Haiti | 0.0 /100 | #318 | Tragic 56.9% |
| Puerto Ricans | 0.0 /100 | #319 | Tragic 56.8% |
| Guatemalans | 0.0 /100 | #320 | Tragic 56.8% |
| Natives/Alaskans | 0.0 /100 | #321 | Tragic 56.6% |
| Immigrants | Caribbean | 0.0 /100 | #322 | Tragic 56.6% |
| Immigrants | Honduras | 0.0 /100 | #323 | Tragic 56.5% |