Honduran vs Senegalese Unemployment Among Women with Children Under 18 years
COMPARE
Honduran
Senegalese
Unemployment Among Women with Children Under 18 years
Unemployment Among Women with Children Under 18 years Comparison
Hondurans
Senegalese
6.4%
UNEMPLOYMENT AMONG WOMEN WITH CHILDREN UNDER 18 YEARS
0.0/ 100
METRIC RATING
294th/ 347
METRIC RANK
6.2%
UNEMPLOYMENT AMONG WOMEN WITH CHILDREN UNDER 18 YEARS
0.0/ 100
METRIC RATING
274th/ 347
METRIC RANK
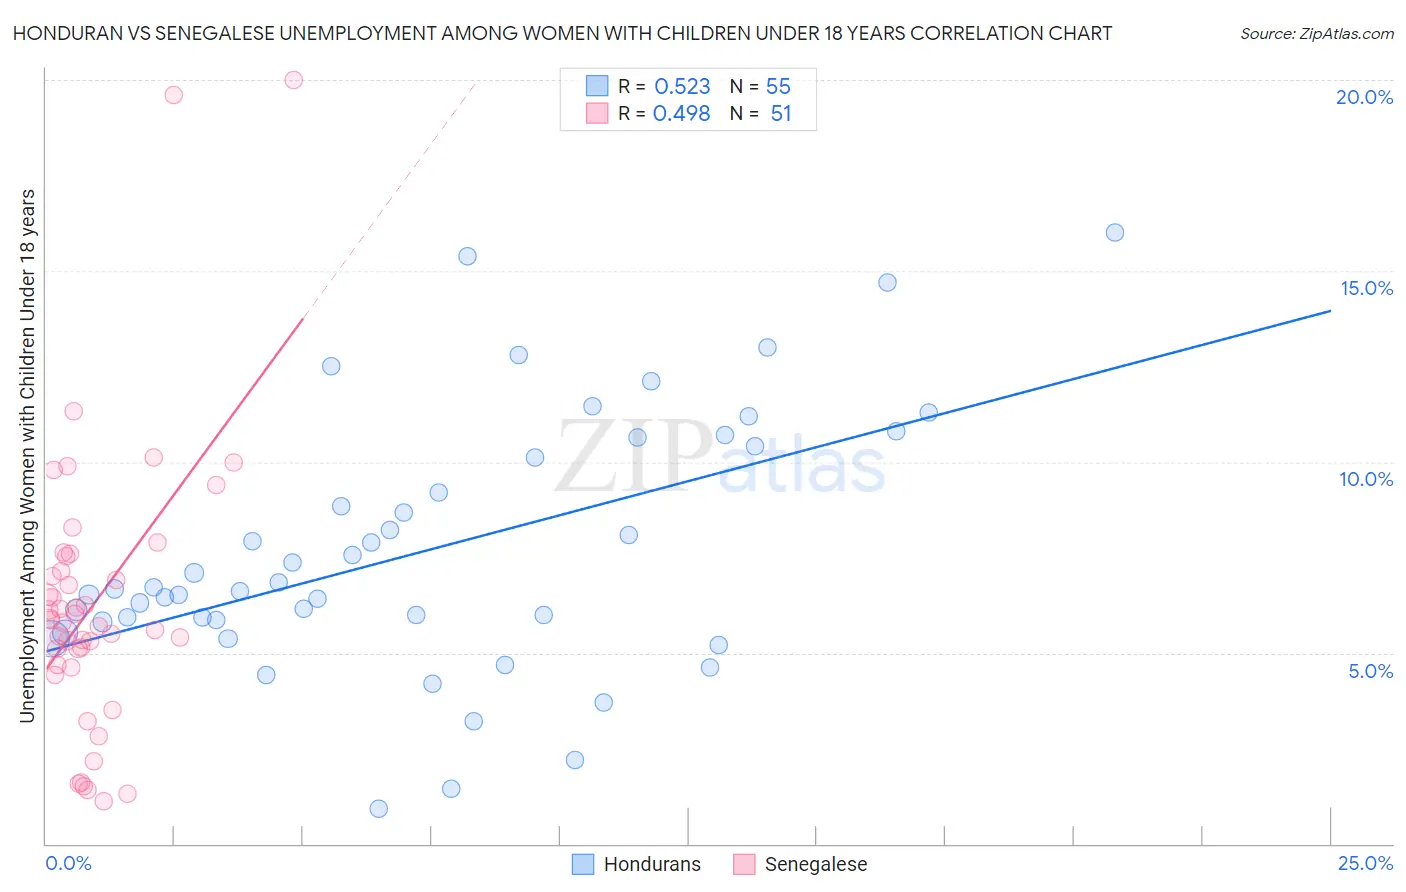
Honduran vs Senegalese Unemployment Among Women with Children Under 18 years Correlation Chart
The statistical analysis conducted on geographies consisting of 348,078,554 people shows a substantial positive correlation between the proportion of Hondurans and unemployment rate among women with children under the age of 18 in the United States with a correlation coefficient (R) of 0.523 and weighted average of 6.4%. Similarly, the statistical analysis conducted on geographies consisting of 77,660,225 people shows a moderate positive correlation between the proportion of Senegalese and unemployment rate among women with children under the age of 18 in the United States with a correlation coefficient (R) of 0.498 and weighted average of 6.2%, a difference of 2.7%.
Unemployment Among Women with Children Under 18 years Correlation Summary
| Measurement | Honduran | Senegalese |
| Minimum | 0.93% | 1.1% |
| Maximum | 16.0% | 20.0% |
| Range | 15.1% | 18.9% |
| Mean | 7.7% | 6.3% |
| Median | 6.7% | 5.9% |
| Interquartile 25% (IQ1) | 5.8% | 4.7% |
| Interquartile 75% (IQ3) | 10.4% | 7.5% |
| Interquartile Range (IQR) | 4.6% | 2.9% |
| Standard Deviation (Sample) | 3.4% | 3.7% |
| Standard Deviation (Population) | 3.3% | 3.6% |
Demographics Similar to Hondurans and Senegalese by Unemployment Among Women with Children Under 18 years
In terms of unemployment among women with children under 18 years, the demographic groups most similar to Hondurans are Immigrants from Bangladesh (6.4%, a difference of 0.030%), Mexican (6.4%, a difference of 0.060%), Immigrants from Guatemala (6.4%, a difference of 0.12%), Blackfeet (6.4%, a difference of 0.24%), and Immigrants from Caribbean (6.4%, a difference of 0.28%). Similarly, the demographic groups most similar to Senegalese are Dutch West Indian (6.2%, a difference of 0.18%), Immigrants from Ghana (6.2%, a difference of 0.28%), Mexican American Indian (6.2%, a difference of 0.30%), Immigrants from Barbados (6.2%, a difference of 0.31%), and Immigrants from Portugal (6.3%, a difference of 0.70%).
| Demographics | Rating | Rank | Unemployment Among Women with Children Under 18 years |
| Senegalese | 0.0 /100 | #274 | Tragic 6.2% |
| Dutch West Indians | 0.0 /100 | #275 | Tragic 6.2% |
| Immigrants | Ghana | 0.0 /100 | #276 | Tragic 6.2% |
| Mexican American Indians | 0.0 /100 | #277 | Tragic 6.2% |
| Immigrants | Barbados | 0.0 /100 | #278 | Tragic 6.2% |
| Immigrants | Portugal | 0.0 /100 | #279 | Tragic 6.3% |
| Guatemalans | 0.0 /100 | #280 | Tragic 6.3% |
| Immigrants | El Salvador | 0.0 /100 | #281 | Tragic 6.3% |
| Immigrants | St. Vincent and the Grenadines | 0.0 /100 | #282 | Tragic 6.3% |
| West Indians | 0.0 /100 | #283 | Tragic 6.3% |
| Immigrants | Grenada | 0.0 /100 | #284 | Tragic 6.3% |
| Bahamians | 0.0 /100 | #285 | Tragic 6.3% |
| Alaskan Athabascans | 0.0 /100 | #286 | Tragic 6.3% |
| Kiowa | 0.0 /100 | #287 | Tragic 6.3% |
| Cree | 0.0 /100 | #288 | Tragic 6.3% |
| Immigrants | Caribbean | 0.0 /100 | #289 | Tragic 6.4% |
| Blackfeet | 0.0 /100 | #290 | Tragic 6.4% |
| Immigrants | Guatemala | 0.0 /100 | #291 | Tragic 6.4% |
| Mexicans | 0.0 /100 | #292 | Tragic 6.4% |
| Immigrants | Bangladesh | 0.0 /100 | #293 | Tragic 6.4% |
| Hondurans | 0.0 /100 | #294 | Tragic 6.4% |