Immigrants from Eastern Europe vs Macedonian College, 1 year or more
COMPARE
Immigrants from Eastern Europe
Macedonian
College, 1 year or more
College, 1 year or more Comparison
Immigrants from Eastern Europe
Macedonians
62.4%
COLLEGE, 1 YEAR OR MORE
97.8/ 100
METRIC RATING
91st/ 347
METRIC RANK
61.8%
COLLEGE, 1 YEAR OR MORE
95.6/ 100
METRIC RATING
111th/ 347
METRIC RANK
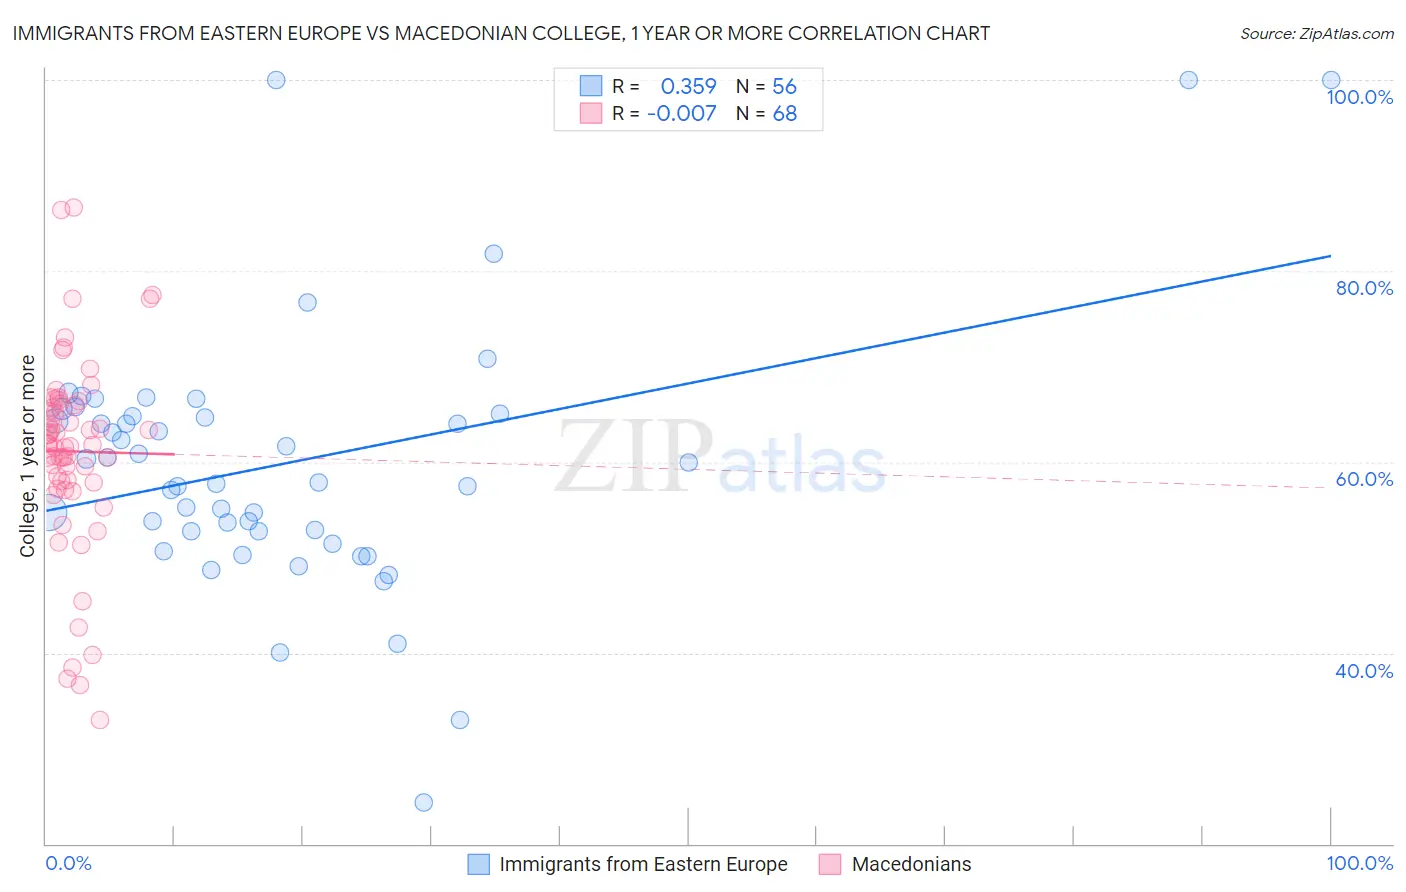
Immigrants from Eastern Europe vs Macedonian College, 1 year or more Correlation Chart
The statistical analysis conducted on geographies consisting of 475,874,060 people shows a mild positive correlation between the proportion of Immigrants from Eastern Europe and percentage of population with at least college, 1 year or more education in the United States with a correlation coefficient (R) of 0.359 and weighted average of 62.4%. Similarly, the statistical analysis conducted on geographies consisting of 132,646,607 people shows no correlation between the proportion of Macedonians and percentage of population with at least college, 1 year or more education in the United States with a correlation coefficient (R) of -0.007 and weighted average of 61.8%, a difference of 0.89%.
College, 1 year or more Correlation Summary
| Measurement | Immigrants from Eastern Europe | Macedonian |
| Minimum | 24.4% | 33.0% |
| Maximum | 100.0% | 86.6% |
| Range | 75.6% | 53.6% |
| Mean | 59.8% | 61.1% |
| Median | 58.9% | 61.7% |
| Interquartile 25% (IQ1) | 52.7% | 57.9% |
| Interquartile 75% (IQ3) | 64.9% | 66.0% |
| Interquartile Range (IQR) | 12.2% | 8.1% |
| Standard Deviation (Sample) | 13.7% | 10.1% |
| Standard Deviation (Population) | 13.6% | 10.1% |
Demographics Similar to Immigrants from Eastern Europe and Macedonians by College, 1 year or more
In terms of college, 1 year or more, the demographic groups most similar to Immigrants from Eastern Europe are Immigrants from Egypt (62.4%, a difference of 0.010%), Romanian (62.4%, a difference of 0.040%), Immigrants from Croatia (62.3%, a difference of 0.090%), British (62.3%, a difference of 0.20%), and Chinese (62.2%, a difference of 0.31%). Similarly, the demographic groups most similar to Macedonians are European (61.8%, a difference of 0.0%), Syrian (61.9%, a difference of 0.020%), Immigrants from Northern Africa (61.9%, a difference of 0.020%), Immigrants from Ukraine (61.9%, a difference of 0.040%), and Immigrants from Nepal (62.0%, a difference of 0.23%).
| Demographics | Rating | Rank | College, 1 year or more |
| Immigrants | Eastern Europe | 97.8 /100 | #91 | Exceptional 62.4% |
| Immigrants | Egypt | 97.8 /100 | #92 | Exceptional 62.4% |
| Romanians | 97.7 /100 | #93 | Exceptional 62.4% |
| Immigrants | Croatia | 97.6 /100 | #94 | Exceptional 62.3% |
| British | 97.4 /100 | #95 | Exceptional 62.3% |
| Chinese | 97.2 /100 | #96 | Exceptional 62.2% |
| Jordanians | 97.2 /100 | #97 | Exceptional 62.2% |
| Carpatho Rusyns | 97.2 /100 | #98 | Exceptional 62.2% |
| Croatians | 97.1 /100 | #99 | Exceptional 62.2% |
| Icelanders | 96.8 /100 | #100 | Exceptional 62.1% |
| Swedes | 96.8 /100 | #101 | Exceptional 62.1% |
| Luxembourgers | 96.7 /100 | #102 | Exceptional 62.1% |
| Afghans | 96.4 /100 | #103 | Exceptional 62.0% |
| Chileans | 96.4 /100 | #104 | Exceptional 62.0% |
| Immigrants | Nepal | 96.3 /100 | #105 | Exceptional 62.0% |
| Palestinians | 96.3 /100 | #106 | Exceptional 62.0% |
| Immigrants | Ukraine | 95.8 /100 | #107 | Exceptional 61.9% |
| Syrians | 95.7 /100 | #108 | Exceptional 61.9% |
| Immigrants | Northern Africa | 95.7 /100 | #109 | Exceptional 61.9% |
| Europeans | 95.6 /100 | #110 | Exceptional 61.8% |
| Macedonians | 95.6 /100 | #111 | Exceptional 61.8% |