Latvian vs Macedonian College, 1 year or more
COMPARE
Latvian
Macedonian
College, 1 year or more
College, 1 year or more Comparison
Latvians
Macedonians
66.1%
COLLEGE, 1 YEAR OR MORE
100.0/ 100
METRIC RATING
26th/ 347
METRIC RANK
61.8%
COLLEGE, 1 YEAR OR MORE
95.6/ 100
METRIC RATING
111th/ 347
METRIC RANK
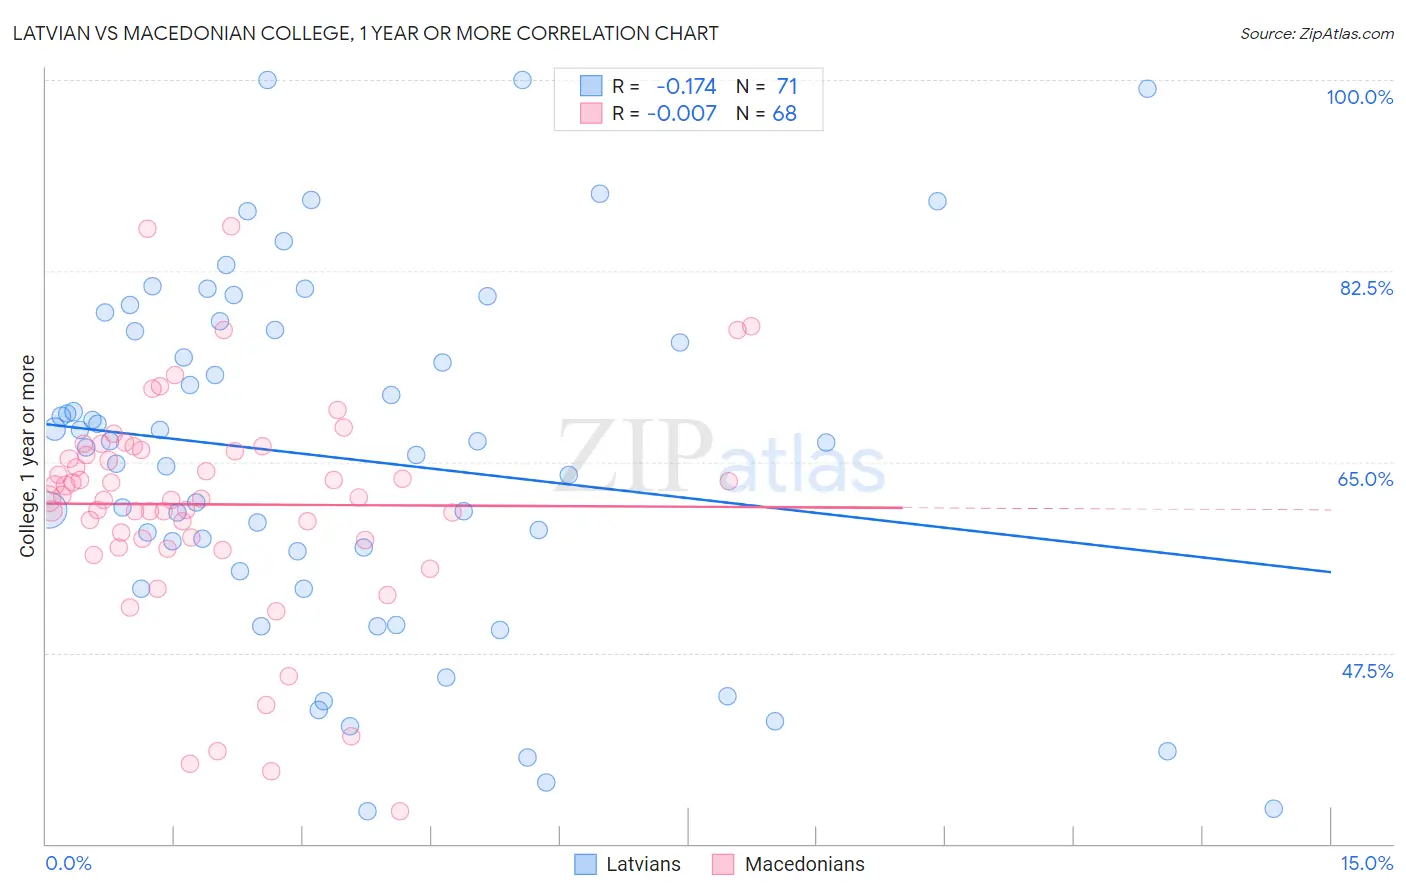
Latvian vs Macedonian College, 1 year or more Correlation Chart
The statistical analysis conducted on geographies consisting of 220,726,880 people shows a poor negative correlation between the proportion of Latvians and percentage of population with at least college, 1 year or more education in the United States with a correlation coefficient (R) of -0.174 and weighted average of 66.1%. Similarly, the statistical analysis conducted on geographies consisting of 132,646,607 people shows no correlation between the proportion of Macedonians and percentage of population with at least college, 1 year or more education in the United States with a correlation coefficient (R) of -0.007 and weighted average of 61.8%, a difference of 6.8%.
College, 1 year or more Correlation Summary
| Measurement | Latvian | Macedonian |
| Minimum | 32.9% | 33.0% |
| Maximum | 100.0% | 86.6% |
| Range | 67.1% | 53.6% |
| Mean | 65.3% | 61.1% |
| Median | 66.8% | 61.7% |
| Interquartile 25% (IQ1) | 54.9% | 57.9% |
| Interquartile 75% (IQ3) | 77.1% | 66.0% |
| Interquartile Range (IQR) | 22.1% | 8.1% |
| Standard Deviation (Sample) | 16.2% | 10.1% |
| Standard Deviation (Population) | 16.1% | 10.1% |
Similar Demographics by College, 1 year or more
Demographics Similar to Latvians by College, 1 year or more
In terms of college, 1 year or more, the demographic groups most similar to Latvians are Indian (Asian) (66.1%, a difference of 0.040%), Immigrants from Ireland (65.9%, a difference of 0.20%), Immigrants from France (65.8%, a difference of 0.37%), Immigrants from Belgium (66.3%, a difference of 0.39%), and Immigrants from China (66.4%, a difference of 0.47%).
| Demographics | Rating | Rank | College, 1 year or more |
| Immigrants | Switzerland | 100.0 /100 | #19 | Exceptional 66.5% |
| Immigrants | Korea | 100.0 /100 | #20 | Exceptional 66.5% |
| Immigrants | Hong Kong | 100.0 /100 | #21 | Exceptional 66.4% |
| Soviet Union | 100.0 /100 | #22 | Exceptional 66.4% |
| Immigrants | China | 100.0 /100 | #23 | Exceptional 66.4% |
| Immigrants | Belgium | 100.0 /100 | #24 | Exceptional 66.3% |
| Indians (Asian) | 100.0 /100 | #25 | Exceptional 66.1% |
| Latvians | 100.0 /100 | #26 | Exceptional 66.1% |
| Immigrants | Ireland | 100.0 /100 | #27 | Exceptional 65.9% |
| Immigrants | France | 100.0 /100 | #28 | Exceptional 65.8% |
| Immigrants | Northern Europe | 100.0 /100 | #29 | Exceptional 65.6% |
| Immigrants | Denmark | 100.0 /100 | #30 | Exceptional 65.6% |
| Turks | 100.0 /100 | #31 | Exceptional 65.5% |
| Bulgarians | 100.0 /100 | #32 | Exceptional 65.5% |
| Immigrants | Sri Lanka | 99.9 /100 | #33 | Exceptional 65.4% |
Demographics Similar to Macedonians by College, 1 year or more
In terms of college, 1 year or more, the demographic groups most similar to Macedonians are European (61.8%, a difference of 0.0%), Syrian (61.9%, a difference of 0.020%), Immigrants from Northern Africa (61.9%, a difference of 0.020%), Immigrants from Ukraine (61.9%, a difference of 0.040%), and Austrian (61.8%, a difference of 0.060%).
| Demographics | Rating | Rank | College, 1 year or more |
| Chileans | 96.4 /100 | #104 | Exceptional 62.0% |
| Immigrants | Nepal | 96.3 /100 | #105 | Exceptional 62.0% |
| Palestinians | 96.3 /100 | #106 | Exceptional 62.0% |
| Immigrants | Ukraine | 95.8 /100 | #107 | Exceptional 61.9% |
| Syrians | 95.7 /100 | #108 | Exceptional 61.9% |
| Immigrants | Northern Africa | 95.7 /100 | #109 | Exceptional 61.9% |
| Europeans | 95.6 /100 | #110 | Exceptional 61.8% |
| Macedonians | 95.6 /100 | #111 | Exceptional 61.8% |
| Austrians | 95.4 /100 | #112 | Exceptional 61.8% |
| Ukrainians | 95.2 /100 | #113 | Exceptional 61.8% |
| Danes | 94.8 /100 | #114 | Exceptional 61.7% |
| Norwegians | 94.5 /100 | #115 | Exceptional 61.7% |
| Lebanese | 94.1 /100 | #116 | Exceptional 61.6% |
| Arabs | 93.9 /100 | #117 | Exceptional 61.6% |
| Immigrants | Brazil | 93.9 /100 | #118 | Exceptional 61.6% |