Bermudan vs Immigrants from Zimbabwe 7th Grade
COMPARE
Bermudan
Immigrants from Zimbabwe
7th Grade
7th Grade Comparison
Bermudans
Immigrants from Zimbabwe
96.1%
7TH GRADE
66.3/ 100
METRIC RATING
161st/ 347
METRIC RANK
96.5%
7TH GRADE
96.6/ 100
METRIC RATING
114th/ 347
METRIC RANK
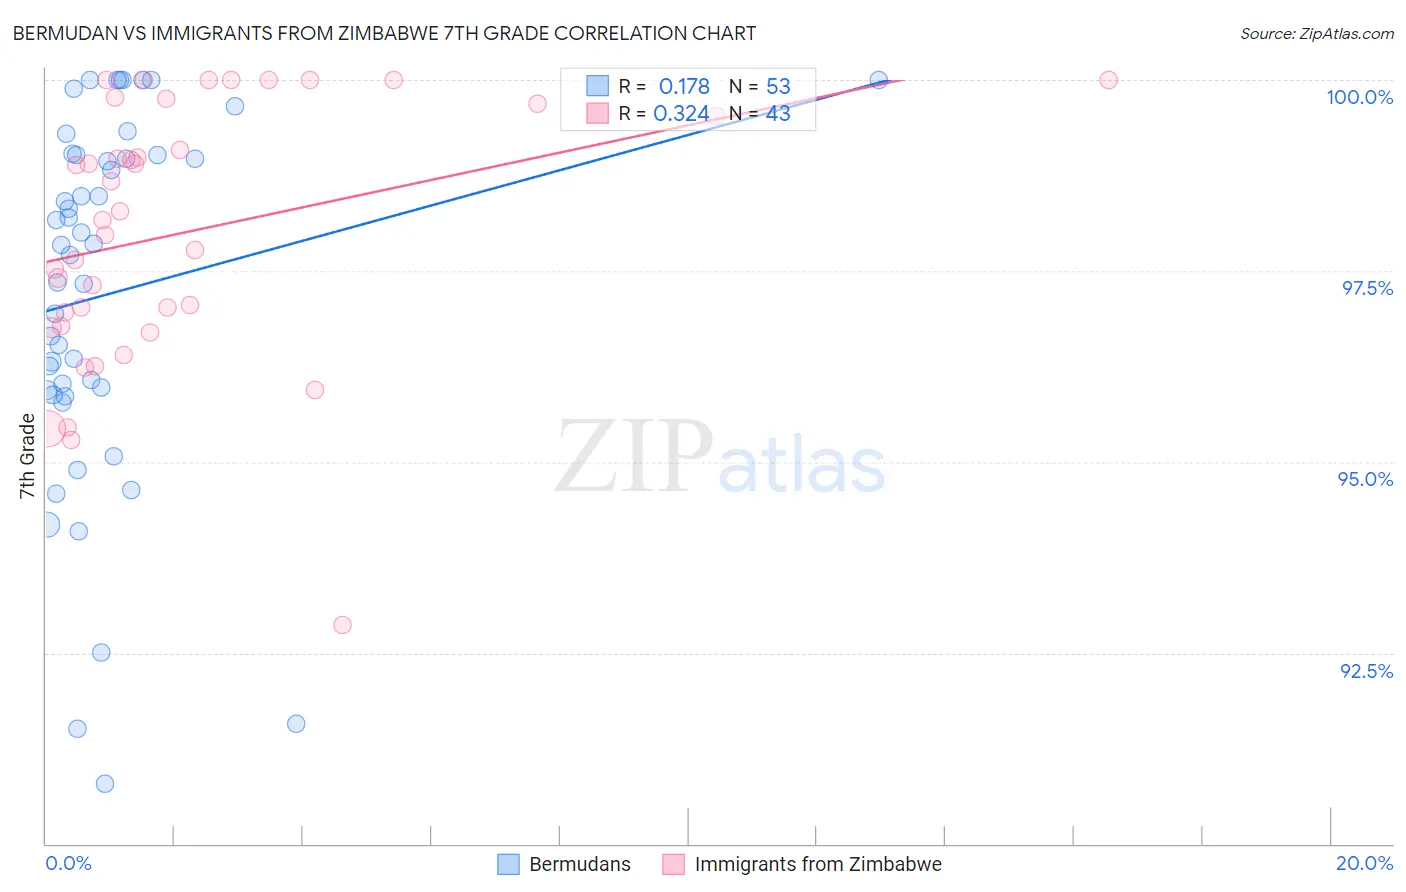
Bermudan vs Immigrants from Zimbabwe 7th Grade Correlation Chart
The statistical analysis conducted on geographies consisting of 55,732,793 people shows a poor positive correlation between the proportion of Bermudans and percentage of population with at least 7th grade education in the United States with a correlation coefficient (R) of 0.178 and weighted average of 96.1%. Similarly, the statistical analysis conducted on geographies consisting of 117,756,150 people shows a mild positive correlation between the proportion of Immigrants from Zimbabwe and percentage of population with at least 7th grade education in the United States with a correlation coefficient (R) of 0.324 and weighted average of 96.5%, a difference of 0.41%.
7th Grade Correlation Summary
| Measurement | Bermudan | Immigrants from Zimbabwe |
| Minimum | 90.8% | 92.9% |
| Maximum | 100.0% | 100.0% |
| Range | 9.2% | 7.1% |
| Mean | 97.2% | 98.0% |
| Median | 97.8% | 98.2% |
| Interquartile 25% (IQ1) | 95.9% | 96.8% |
| Interquartile 75% (IQ3) | 99.0% | 99.7% |
| Interquartile Range (IQR) | 3.1% | 2.9% |
| Standard Deviation (Sample) | 2.4% | 1.7% |
| Standard Deviation (Population) | 2.3% | 1.7% |
Similar Demographics by 7th Grade
Demographics Similar to Bermudans by 7th Grade
In terms of 7th grade, the demographic groups most similar to Bermudans are Immigrants from Kenya (96.1%, a difference of 0.0%), Alsatian (96.1%, a difference of 0.010%), Pima (96.1%, a difference of 0.010%), Arab (96.2%, a difference of 0.020%), and Spaniard (96.1%, a difference of 0.020%).
| Demographics | Rating | Rank | 7th Grade |
| Immigrants | Israel | 77.6 /100 | #154 | Good 96.2% |
| Immigrants | Jordan | 77.0 /100 | #155 | Good 96.2% |
| Kenyans | 76.2 /100 | #156 | Good 96.2% |
| Ugandans | 75.5 /100 | #157 | Good 96.2% |
| Arabs | 68.6 /100 | #158 | Good 96.2% |
| Alsatians | 67.2 /100 | #159 | Good 96.1% |
| Immigrants | Kenya | 66.8 /100 | #160 | Good 96.1% |
| Bermudans | 66.3 /100 | #161 | Good 96.1% |
| Pima | 64.3 /100 | #162 | Good 96.1% |
| Spaniards | 62.6 /100 | #163 | Good 96.1% |
| Immigrants | Italy | 62.1 /100 | #164 | Good 96.1% |
| Immigrants | Taiwan | 61.5 /100 | #165 | Good 96.1% |
| Immigrants | Kazakhstan | 61.0 /100 | #166 | Good 96.1% |
| Immigrants | Sri Lanka | 59.9 /100 | #167 | Average 96.1% |
| Immigrants | Poland | 59.0 /100 | #168 | Average 96.1% |
Demographics Similar to Immigrants from Zimbabwe by 7th Grade
In terms of 7th grade, the demographic groups most similar to Immigrants from Zimbabwe are Choctaw (96.5%, a difference of 0.0%), Syrian (96.5%, a difference of 0.0%), Pueblo (96.5%, a difference of 0.010%), Nonimmigrants (96.5%, a difference of 0.020%), and Okinawan (96.6%, a difference of 0.040%).
| Demographics | Rating | Rank | 7th Grade |
| Lumbee | 97.8 /100 | #107 | Exceptional 96.6% |
| Immigrants | Saudi Arabia | 97.8 /100 | #108 | Exceptional 96.6% |
| Bhutanese | 97.7 /100 | #109 | Exceptional 96.6% |
| Okinawans | 97.4 /100 | #110 | Exceptional 96.6% |
| Immigrants | Latvia | 97.4 /100 | #111 | Exceptional 96.6% |
| Immigrants | Nonimmigrants | 97.0 /100 | #112 | Exceptional 96.5% |
| Pueblo | 96.8 /100 | #113 | Exceptional 96.5% |
| Immigrants | Zimbabwe | 96.6 /100 | #114 | Exceptional 96.5% |
| Choctaw | 96.6 /100 | #115 | Exceptional 96.5% |
| Syrians | 96.6 /100 | #116 | Exceptional 96.5% |
| Immigrants | Moldova | 95.7 /100 | #117 | Exceptional 96.5% |
| Immigrants | Japan | 95.5 /100 | #118 | Exceptional 96.5% |
| Immigrants | Norway | 95.2 /100 | #119 | Exceptional 96.5% |
| Immigrants | Croatia | 95.0 /100 | #120 | Exceptional 96.5% |
| Cheyenne | 94.9 /100 | #121 | Exceptional 96.5% |