Honduran vs Asian 7th Grade
COMPARE
Honduran
Asian
7th Grade
7th Grade Comparison
Hondurans
Asians
92.9%
7TH GRADE
0.0/ 100
METRIC RATING
331st/ 347
METRIC RANK
95.5%
7TH GRADE
2.6/ 100
METRIC RATING
236th/ 347
METRIC RANK
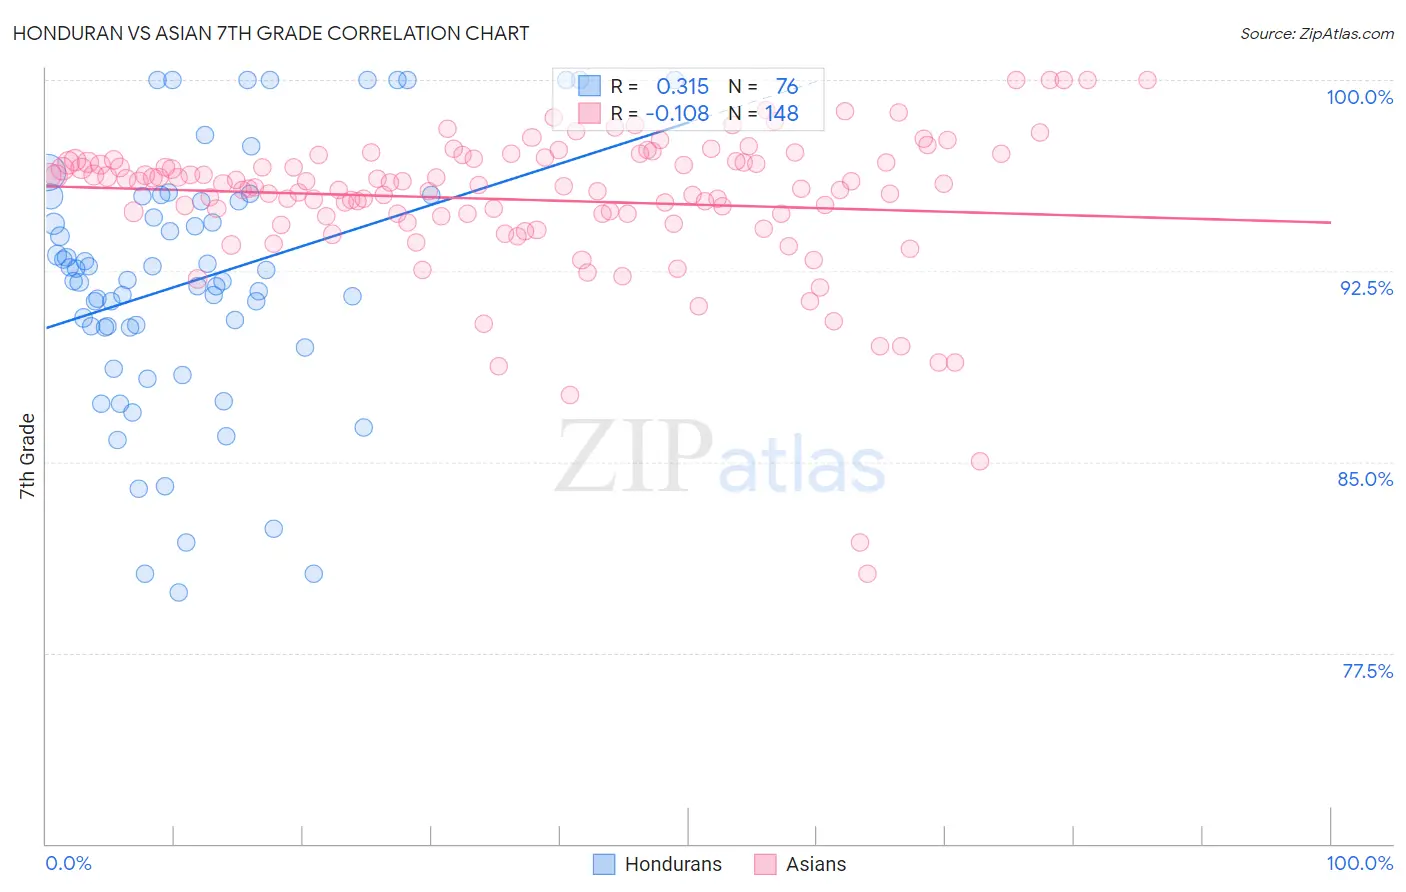
Honduran vs Asian 7th Grade Correlation Chart
The statistical analysis conducted on geographies consisting of 357,784,803 people shows a mild positive correlation between the proportion of Hondurans and percentage of population with at least 7th grade education in the United States with a correlation coefficient (R) of 0.315 and weighted average of 92.9%. Similarly, the statistical analysis conducted on geographies consisting of 550,917,032 people shows a poor negative correlation between the proportion of Asians and percentage of population with at least 7th grade education in the United States with a correlation coefficient (R) of -0.108 and weighted average of 95.5%, a difference of 2.8%.
7th Grade Correlation Summary
| Measurement | Honduran | Asian |
| Minimum | 79.9% | 80.6% |
| Maximum | 100.0% | 100.0% |
| Range | 20.1% | 19.4% |
| Mean | 92.1% | 95.3% |
| Median | 92.1% | 95.9% |
| Interquartile 25% (IQ1) | 90.3% | 94.7% |
| Interquartile 75% (IQ3) | 95.3% | 96.9% |
| Interquartile Range (IQR) | 5.1% | 2.2% |
| Standard Deviation (Sample) | 5.0% | 2.9% |
| Standard Deviation (Population) | 4.9% | 2.9% |
Similar Demographics by 7th Grade
Demographics Similar to Hondurans by 7th Grade
In terms of 7th grade, the demographic groups most similar to Hondurans are Immigrants from Dominican Republic (92.9%, a difference of 0.040%), Immigrants from the Azores (93.0%, a difference of 0.090%), Immigrants from Nicaragua (93.0%, a difference of 0.13%), Hispanic or Latino (92.7%, a difference of 0.14%), and Immigrants from Armenia (92.7%, a difference of 0.16%).
| Demographics | Rating | Rank | 7th Grade |
| Dominicans | 0.0 /100 | #324 | Tragic 93.3% |
| Central American Indians | 0.0 /100 | #325 | Tragic 93.3% |
| Nepalese | 0.0 /100 | #326 | Tragic 93.2% |
| Immigrants | Cabo Verde | 0.0 /100 | #327 | Tragic 93.1% |
| Immigrants | Nicaragua | 0.0 /100 | #328 | Tragic 93.0% |
| Immigrants | Azores | 0.0 /100 | #329 | Tragic 93.0% |
| Immigrants | Dominican Republic | 0.0 /100 | #330 | Tragic 92.9% |
| Hondurans | 0.0 /100 | #331 | Tragic 92.9% |
| Hispanics or Latinos | 0.0 /100 | #332 | Tragic 92.7% |
| Immigrants | Armenia | 0.0 /100 | #333 | Tragic 92.7% |
| Immigrants | Yemen | 0.0 /100 | #334 | Tragic 92.6% |
| Mexican American Indians | 0.0 /100 | #335 | Tragic 92.6% |
| Immigrants | Honduras | 0.0 /100 | #336 | Tragic 92.5% |
| Immigrants | Latin America | 0.0 /100 | #337 | Tragic 92.2% |
| Central Americans | 0.0 /100 | #338 | Tragic 92.1% |
Demographics Similar to Asians by 7th Grade
In terms of 7th grade, the demographic groups most similar to Asians are Immigrants from Africa (95.5%, a difference of 0.010%), Immigrants from Asia (95.5%, a difference of 0.010%), Nigerian (95.5%, a difference of 0.020%), Indian (Asian) (95.5%, a difference of 0.020%), and Jamaican (95.5%, a difference of 0.030%).
| Demographics | Rating | Rank | 7th Grade |
| Immigrants | Panama | 4.9 /100 | #229 | Tragic 95.6% |
| Natives/Alaskans | 4.2 /100 | #230 | Tragic 95.6% |
| Senegalese | 4.0 /100 | #231 | Tragic 95.6% |
| Costa Ricans | 3.3 /100 | #232 | Tragic 95.5% |
| Immigrants | Indonesia | 3.3 /100 | #233 | Tragic 95.5% |
| Nigerians | 3.0 /100 | #234 | Tragic 95.5% |
| Immigrants | Africa | 2.7 /100 | #235 | Tragic 95.5% |
| Asians | 2.6 /100 | #236 | Tragic 95.5% |
| Immigrants | Asia | 2.3 /100 | #237 | Tragic 95.5% |
| Indians (Asian) | 2.3 /100 | #238 | Tragic 95.5% |
| Jamaicans | 2.2 /100 | #239 | Tragic 95.5% |
| Immigrants | Sierra Leone | 2.0 /100 | #240 | Tragic 95.5% |
| South American Indians | 2.0 /100 | #241 | Tragic 95.5% |
| Immigrants | Senegal | 1.9 /100 | #242 | Tragic 95.5% |
| U.S. Virgin Islanders | 1.6 /100 | #243 | Tragic 95.4% |