Honduran vs Immigrants from Caribbean 7th Grade
COMPARE
Honduran
Immigrants from Caribbean
7th Grade
7th Grade Comparison
Hondurans
Immigrants from Caribbean
92.9%
7TH GRADE
0.0/ 100
METRIC RATING
331st/ 347
METRIC RANK
94.0%
7TH GRADE
0.0/ 100
METRIC RATING
310th/ 347
METRIC RANK
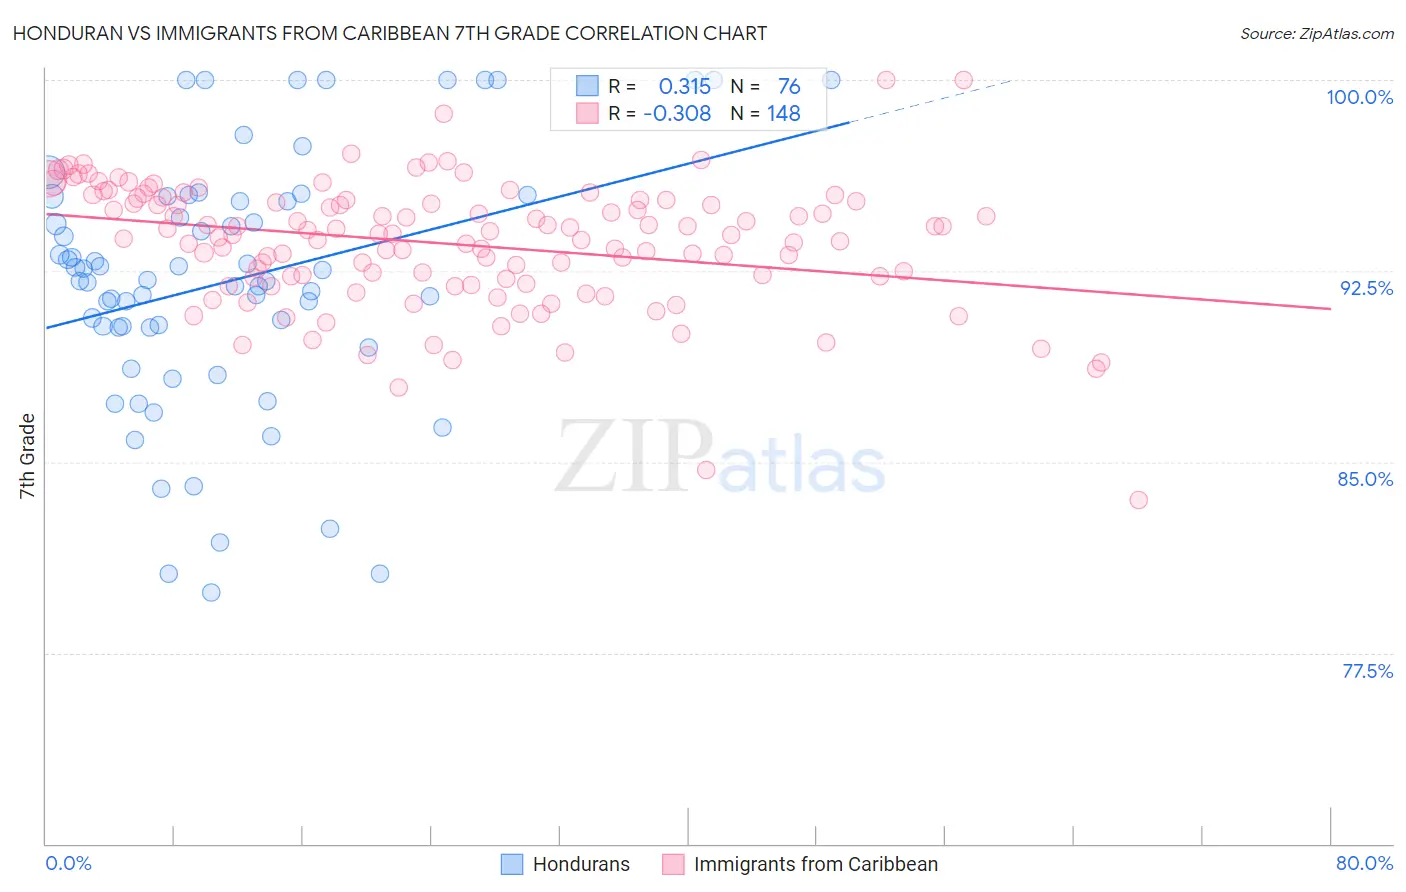
Honduran vs Immigrants from Caribbean 7th Grade Correlation Chart
The statistical analysis conducted on geographies consisting of 357,784,803 people shows a mild positive correlation between the proportion of Hondurans and percentage of population with at least 7th grade education in the United States with a correlation coefficient (R) of 0.315 and weighted average of 92.9%. Similarly, the statistical analysis conducted on geographies consisting of 450,064,731 people shows a mild negative correlation between the proportion of Immigrants from Caribbean and percentage of population with at least 7th grade education in the United States with a correlation coefficient (R) of -0.308 and weighted average of 94.0%, a difference of 1.3%.
7th Grade Correlation Summary
| Measurement | Honduran | Immigrants from Caribbean |
| Minimum | 79.9% | 83.5% |
| Maximum | 100.0% | 100.0% |
| Range | 20.1% | 16.5% |
| Mean | 92.1% | 93.6% |
| Median | 92.1% | 93.9% |
| Interquartile 25% (IQ1) | 90.3% | 92.2% |
| Interquartile 75% (IQ3) | 95.3% | 95.3% |
| Interquartile Range (IQR) | 5.1% | 3.1% |
| Standard Deviation (Sample) | 5.0% | 2.5% |
| Standard Deviation (Population) | 4.9% | 2.5% |
Similar Demographics by 7th Grade
Demographics Similar to Hondurans by 7th Grade
In terms of 7th grade, the demographic groups most similar to Hondurans are Immigrants from Dominican Republic (92.9%, a difference of 0.040%), Immigrants from the Azores (93.0%, a difference of 0.090%), Immigrants from Nicaragua (93.0%, a difference of 0.13%), Hispanic or Latino (92.7%, a difference of 0.14%), and Immigrants from Armenia (92.7%, a difference of 0.16%).
| Demographics | Rating | Rank | 7th Grade |
| Dominicans | 0.0 /100 | #324 | Tragic 93.3% |
| Central American Indians | 0.0 /100 | #325 | Tragic 93.3% |
| Nepalese | 0.0 /100 | #326 | Tragic 93.2% |
| Immigrants | Cabo Verde | 0.0 /100 | #327 | Tragic 93.1% |
| Immigrants | Nicaragua | 0.0 /100 | #328 | Tragic 93.0% |
| Immigrants | Azores | 0.0 /100 | #329 | Tragic 93.0% |
| Immigrants | Dominican Republic | 0.0 /100 | #330 | Tragic 92.9% |
| Hondurans | 0.0 /100 | #331 | Tragic 92.9% |
| Hispanics or Latinos | 0.0 /100 | #332 | Tragic 92.7% |
| Immigrants | Armenia | 0.0 /100 | #333 | Tragic 92.7% |
| Immigrants | Yemen | 0.0 /100 | #334 | Tragic 92.6% |
| Mexican American Indians | 0.0 /100 | #335 | Tragic 92.6% |
| Immigrants | Honduras | 0.0 /100 | #336 | Tragic 92.5% |
| Immigrants | Latin America | 0.0 /100 | #337 | Tragic 92.2% |
| Central Americans | 0.0 /100 | #338 | Tragic 92.1% |
Demographics Similar to Immigrants from Caribbean by 7th Grade
In terms of 7th grade, the demographic groups most similar to Immigrants from Caribbean are Ecuadorian (94.0%, a difference of 0.010%), Puerto Rican (94.0%, a difference of 0.010%), Immigrants (94.0%, a difference of 0.050%), Immigrants from Bangladesh (94.0%, a difference of 0.050%), and Cape Verdean (94.1%, a difference of 0.070%).
| Demographics | Rating | Rank | 7th Grade |
| Sri Lankans | 0.0 /100 | #303 | Tragic 94.4% |
| Immigrants | Haiti | 0.0 /100 | #304 | Tragic 94.3% |
| Guyanese | 0.0 /100 | #305 | Tragic 94.3% |
| Immigrants | Guyana | 0.0 /100 | #306 | Tragic 94.2% |
| Immigrants | Portugal | 0.0 /100 | #307 | Tragic 94.2% |
| Cape Verdeans | 0.0 /100 | #308 | Tragic 94.1% |
| Ecuadorians | 0.0 /100 | #309 | Tragic 94.0% |
| Immigrants | Caribbean | 0.0 /100 | #310 | Tragic 94.0% |
| Puerto Ricans | 0.0 /100 | #311 | Tragic 94.0% |
| Immigrants | Immigrants | 0.0 /100 | #312 | Tragic 94.0% |
| Immigrants | Bangladesh | 0.0 /100 | #313 | Tragic 94.0% |
| Japanese | 0.0 /100 | #314 | Tragic 94.0% |
| Vietnamese | 0.0 /100 | #315 | Tragic 93.9% |
| Immigrants | Vietnam | 0.0 /100 | #316 | Tragic 93.9% |
| Immigrants | Cuba | 0.0 /100 | #317 | Tragic 93.8% |