Honduran vs Spaniard 7th Grade
COMPARE
Honduran
Spaniard
7th Grade
7th Grade Comparison
Hondurans
Spaniards
92.9%
7TH GRADE
0.0/ 100
METRIC RATING
331st/ 347
METRIC RANK
96.1%
7TH GRADE
62.6/ 100
METRIC RATING
163rd/ 347
METRIC RANK
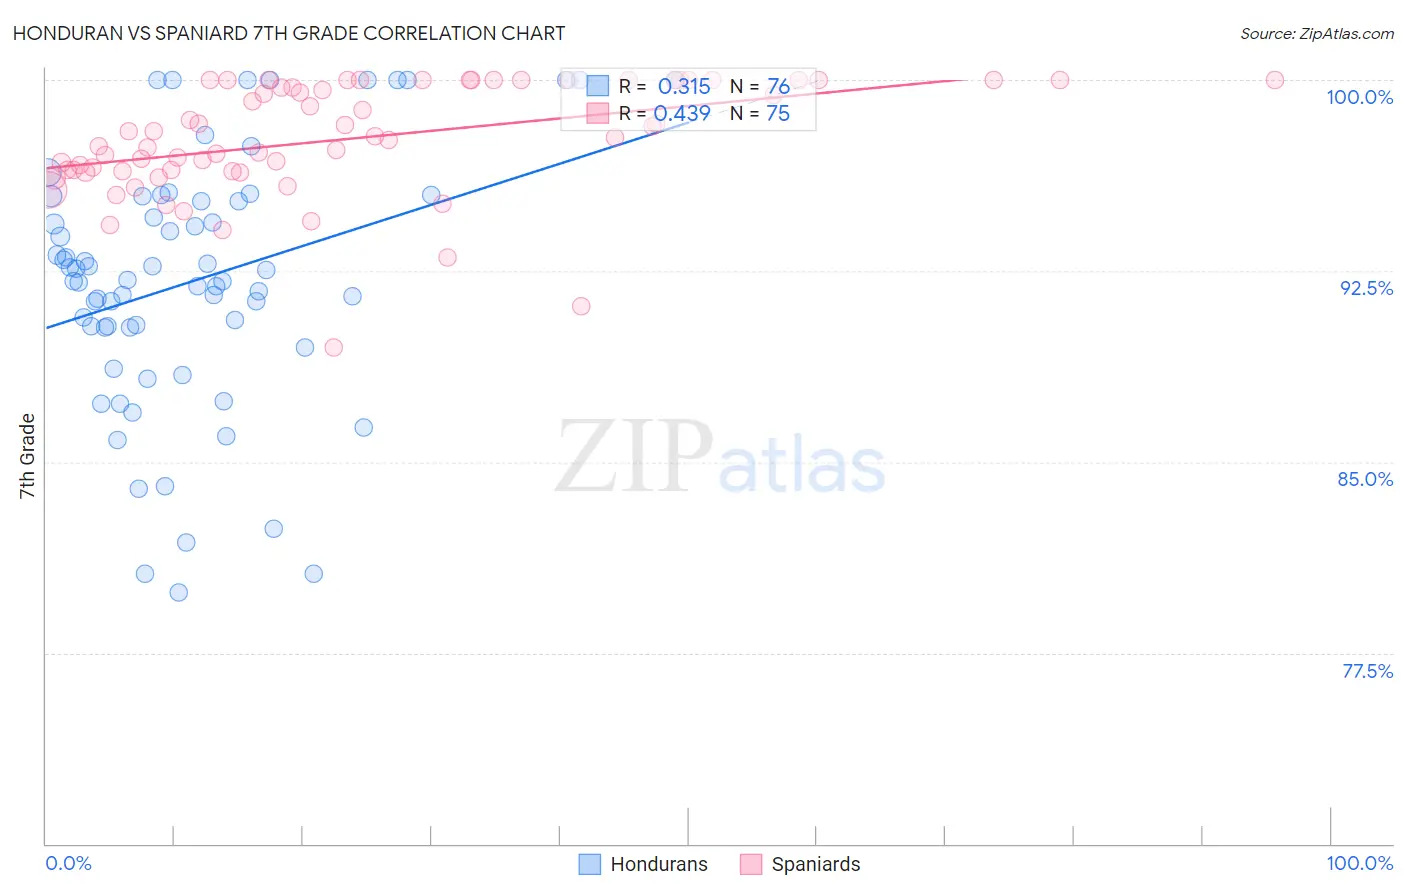
Honduran vs Spaniard 7th Grade Correlation Chart
The statistical analysis conducted on geographies consisting of 357,784,803 people shows a mild positive correlation between the proportion of Hondurans and percentage of population with at least 7th grade education in the United States with a correlation coefficient (R) of 0.315 and weighted average of 92.9%. Similarly, the statistical analysis conducted on geographies consisting of 443,544,503 people shows a moderate positive correlation between the proportion of Spaniards and percentage of population with at least 7th grade education in the United States with a correlation coefficient (R) of 0.439 and weighted average of 96.1%, a difference of 3.5%.
7th Grade Correlation Summary
| Measurement | Honduran | Spaniard |
| Minimum | 79.9% | 89.5% |
| Maximum | 100.0% | 100.0% |
| Range | 20.1% | 10.5% |
| Mean | 92.1% | 97.7% |
| Median | 92.1% | 97.8% |
| Interquartile 25% (IQ1) | 90.3% | 96.4% |
| Interquartile 75% (IQ3) | 95.3% | 100.0% |
| Interquartile Range (IQR) | 5.1% | 3.6% |
| Standard Deviation (Sample) | 5.0% | 2.2% |
| Standard Deviation (Population) | 4.9% | 2.2% |
Similar Demographics by 7th Grade
Demographics Similar to Hondurans by 7th Grade
In terms of 7th grade, the demographic groups most similar to Hondurans are Immigrants from Dominican Republic (92.9%, a difference of 0.040%), Immigrants from the Azores (93.0%, a difference of 0.090%), Immigrants from Nicaragua (93.0%, a difference of 0.13%), Hispanic or Latino (92.7%, a difference of 0.14%), and Immigrants from Armenia (92.7%, a difference of 0.16%).
| Demographics | Rating | Rank | 7th Grade |
| Dominicans | 0.0 /100 | #324 | Tragic 93.3% |
| Central American Indians | 0.0 /100 | #325 | Tragic 93.3% |
| Nepalese | 0.0 /100 | #326 | Tragic 93.2% |
| Immigrants | Cabo Verde | 0.0 /100 | #327 | Tragic 93.1% |
| Immigrants | Nicaragua | 0.0 /100 | #328 | Tragic 93.0% |
| Immigrants | Azores | 0.0 /100 | #329 | Tragic 93.0% |
| Immigrants | Dominican Republic | 0.0 /100 | #330 | Tragic 92.9% |
| Hondurans | 0.0 /100 | #331 | Tragic 92.9% |
| Hispanics or Latinos | 0.0 /100 | #332 | Tragic 92.7% |
| Immigrants | Armenia | 0.0 /100 | #333 | Tragic 92.7% |
| Immigrants | Yemen | 0.0 /100 | #334 | Tragic 92.6% |
| Mexican American Indians | 0.0 /100 | #335 | Tragic 92.6% |
| Immigrants | Honduras | 0.0 /100 | #336 | Tragic 92.5% |
| Immigrants | Latin America | 0.0 /100 | #337 | Tragic 92.2% |
| Central Americans | 0.0 /100 | #338 | Tragic 92.1% |
Demographics Similar to Spaniards by 7th Grade
In terms of 7th grade, the demographic groups most similar to Spaniards are Immigrants from Italy (96.1%, a difference of 0.0%), Pima (96.1%, a difference of 0.010%), Immigrants from Taiwan (96.1%, a difference of 0.010%), Immigrants from Kazakhstan (96.1%, a difference of 0.010%), and Bermudan (96.1%, a difference of 0.020%).
| Demographics | Rating | Rank | 7th Grade |
| Kenyans | 76.2 /100 | #156 | Good 96.2% |
| Ugandans | 75.5 /100 | #157 | Good 96.2% |
| Arabs | 68.6 /100 | #158 | Good 96.2% |
| Alsatians | 67.2 /100 | #159 | Good 96.1% |
| Immigrants | Kenya | 66.8 /100 | #160 | Good 96.1% |
| Bermudans | 66.3 /100 | #161 | Good 96.1% |
| Pima | 64.3 /100 | #162 | Good 96.1% |
| Spaniards | 62.6 /100 | #163 | Good 96.1% |
| Immigrants | Italy | 62.1 /100 | #164 | Good 96.1% |
| Immigrants | Taiwan | 61.5 /100 | #165 | Good 96.1% |
| Immigrants | Kazakhstan | 61.0 /100 | #166 | Good 96.1% |
| Immigrants | Sri Lanka | 59.9 /100 | #167 | Average 96.1% |
| Immigrants | Poland | 59.0 /100 | #168 | Average 96.1% |
| Ute | 55.8 /100 | #169 | Average 96.1% |
| Immigrants | Ukraine | 55.0 /100 | #170 | Average 96.1% |