Honduran vs Maltese 7th Grade
COMPARE
Honduran
Maltese
7th Grade
7th Grade Comparison
Hondurans
Maltese
92.9%
7TH GRADE
0.0/ 100
METRIC RATING
331st/ 347
METRIC RANK
97.1%
7TH GRADE
99.9/ 100
METRIC RATING
43rd/ 347
METRIC RANK
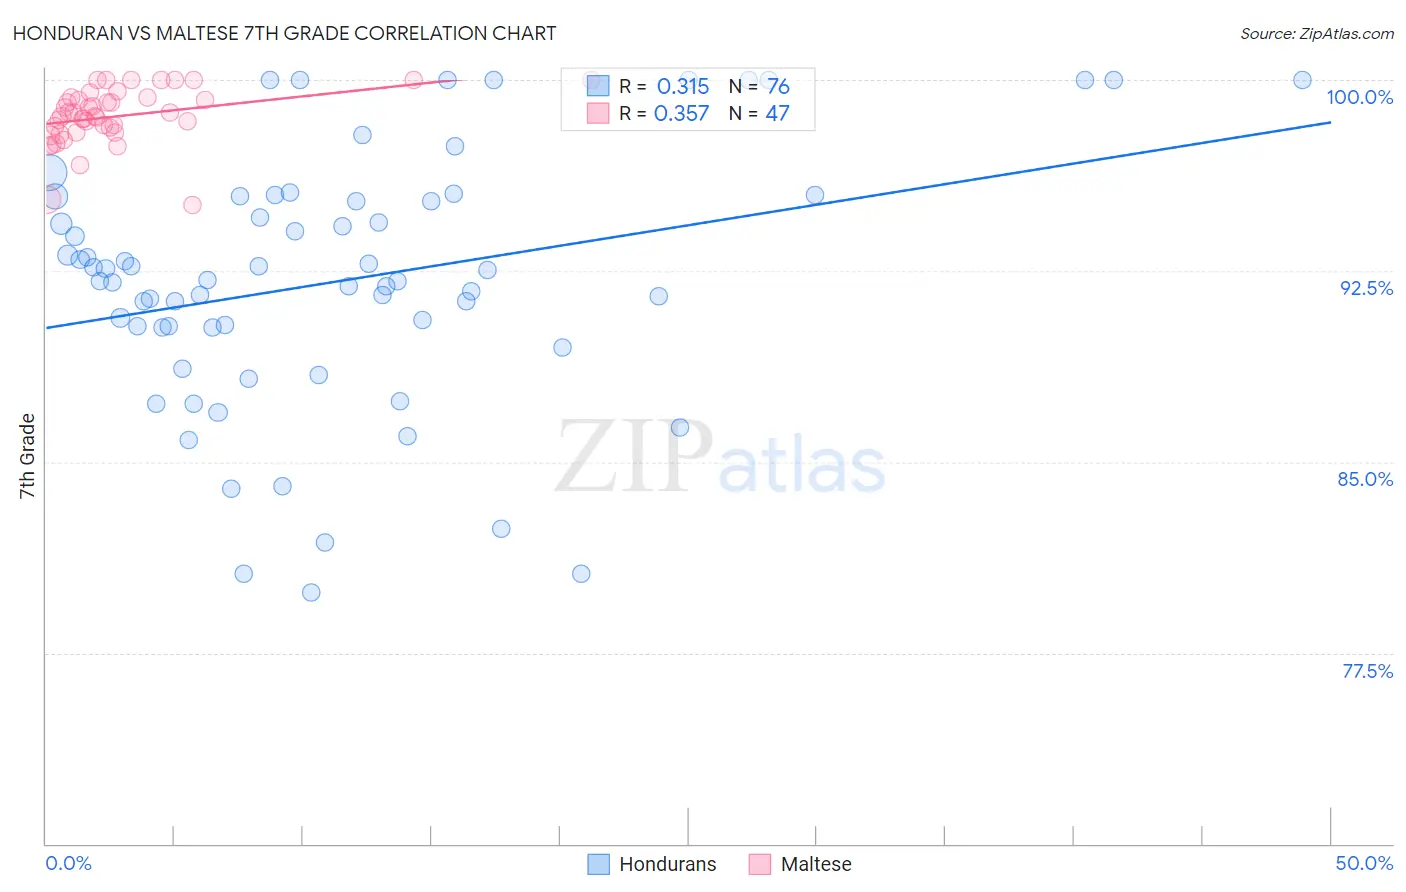
Honduran vs Maltese 7th Grade Correlation Chart
The statistical analysis conducted on geographies consisting of 357,784,803 people shows a mild positive correlation between the proportion of Hondurans and percentage of population with at least 7th grade education in the United States with a correlation coefficient (R) of 0.315 and weighted average of 92.9%. Similarly, the statistical analysis conducted on geographies consisting of 126,476,608 people shows a mild positive correlation between the proportion of Maltese and percentage of population with at least 7th grade education in the United States with a correlation coefficient (R) of 0.357 and weighted average of 97.1%, a difference of 4.6%.
7th Grade Correlation Summary
| Measurement | Honduran | Maltese |
| Minimum | 79.9% | 95.1% |
| Maximum | 100.0% | 100.0% |
| Range | 20.1% | 4.9% |
| Mean | 92.1% | 98.6% |
| Median | 92.1% | 98.6% |
| Interquartile 25% (IQ1) | 90.3% | 97.9% |
| Interquartile 75% (IQ3) | 95.3% | 99.3% |
| Interquartile Range (IQR) | 5.1% | 1.4% |
| Standard Deviation (Sample) | 5.0% | 1.1% |
| Standard Deviation (Population) | 4.9% | 1.1% |
Similar Demographics by 7th Grade
Demographics Similar to Hondurans by 7th Grade
In terms of 7th grade, the demographic groups most similar to Hondurans are Immigrants from Dominican Republic (92.9%, a difference of 0.040%), Immigrants from the Azores (93.0%, a difference of 0.090%), Immigrants from Nicaragua (93.0%, a difference of 0.13%), Hispanic or Latino (92.7%, a difference of 0.14%), and Immigrants from Armenia (92.7%, a difference of 0.16%).
| Demographics | Rating | Rank | 7th Grade |
| Dominicans | 0.0 /100 | #324 | Tragic 93.3% |
| Central American Indians | 0.0 /100 | #325 | Tragic 93.3% |
| Nepalese | 0.0 /100 | #326 | Tragic 93.2% |
| Immigrants | Cabo Verde | 0.0 /100 | #327 | Tragic 93.1% |
| Immigrants | Nicaragua | 0.0 /100 | #328 | Tragic 93.0% |
| Immigrants | Azores | 0.0 /100 | #329 | Tragic 93.0% |
| Immigrants | Dominican Republic | 0.0 /100 | #330 | Tragic 92.9% |
| Hondurans | 0.0 /100 | #331 | Tragic 92.9% |
| Hispanics or Latinos | 0.0 /100 | #332 | Tragic 92.7% |
| Immigrants | Armenia | 0.0 /100 | #333 | Tragic 92.7% |
| Immigrants | Yemen | 0.0 /100 | #334 | Tragic 92.6% |
| Mexican American Indians | 0.0 /100 | #335 | Tragic 92.6% |
| Immigrants | Honduras | 0.0 /100 | #336 | Tragic 92.5% |
| Immigrants | Latin America | 0.0 /100 | #337 | Tragic 92.2% |
| Central Americans | 0.0 /100 | #338 | Tragic 92.1% |
Demographics Similar to Maltese by 7th Grade
In terms of 7th grade, the demographic groups most similar to Maltese are Northern European (97.1%, a difference of 0.0%), Czechoslovakian (97.1%, a difference of 0.010%), Aleut (97.1%, a difference of 0.010%), Chinese (97.1%, a difference of 0.030%), and Bulgarian (97.1%, a difference of 0.040%).
| Demographics | Rating | Rank | 7th Grade |
| Hungarians | 100.0 /100 | #36 | Exceptional 97.2% |
| British | 100.0 /100 | #37 | Exceptional 97.2% |
| Belgians | 100.0 /100 | #38 | Exceptional 97.2% |
| Latvians | 100.0 /100 | #39 | Exceptional 97.2% |
| Luxembourgers | 100.0 /100 | #40 | Exceptional 97.2% |
| Eastern Europeans | 100.0 /100 | #41 | Exceptional 97.2% |
| Chinese | 99.9 /100 | #42 | Exceptional 97.1% |
| Maltese | 99.9 /100 | #43 | Exceptional 97.1% |
| Northern Europeans | 99.9 /100 | #44 | Exceptional 97.1% |
| Czechoslovakians | 99.9 /100 | #45 | Exceptional 97.1% |
| Aleuts | 99.9 /100 | #46 | Exceptional 97.1% |
| Bulgarians | 99.9 /100 | #47 | Exceptional 97.1% |
| Celtics | 99.9 /100 | #48 | Exceptional 97.1% |
| Slavs | 99.9 /100 | #49 | Exceptional 97.1% |
| Immigrants | Scotland | 99.9 /100 | #50 | Exceptional 97.1% |