Hmong vs Scottish Currently Married
COMPARE
Hmong
Scottish
Currently Married
Currently Married Comparison
Hmong
Scottish
47.1%
CURRENTLY MARRIED
73.4/ 100
METRIC RATING
144th/ 347
METRIC RANK
49.2%
CURRENTLY MARRIED
99.8/ 100
METRIC RATING
21st/ 347
METRIC RANK
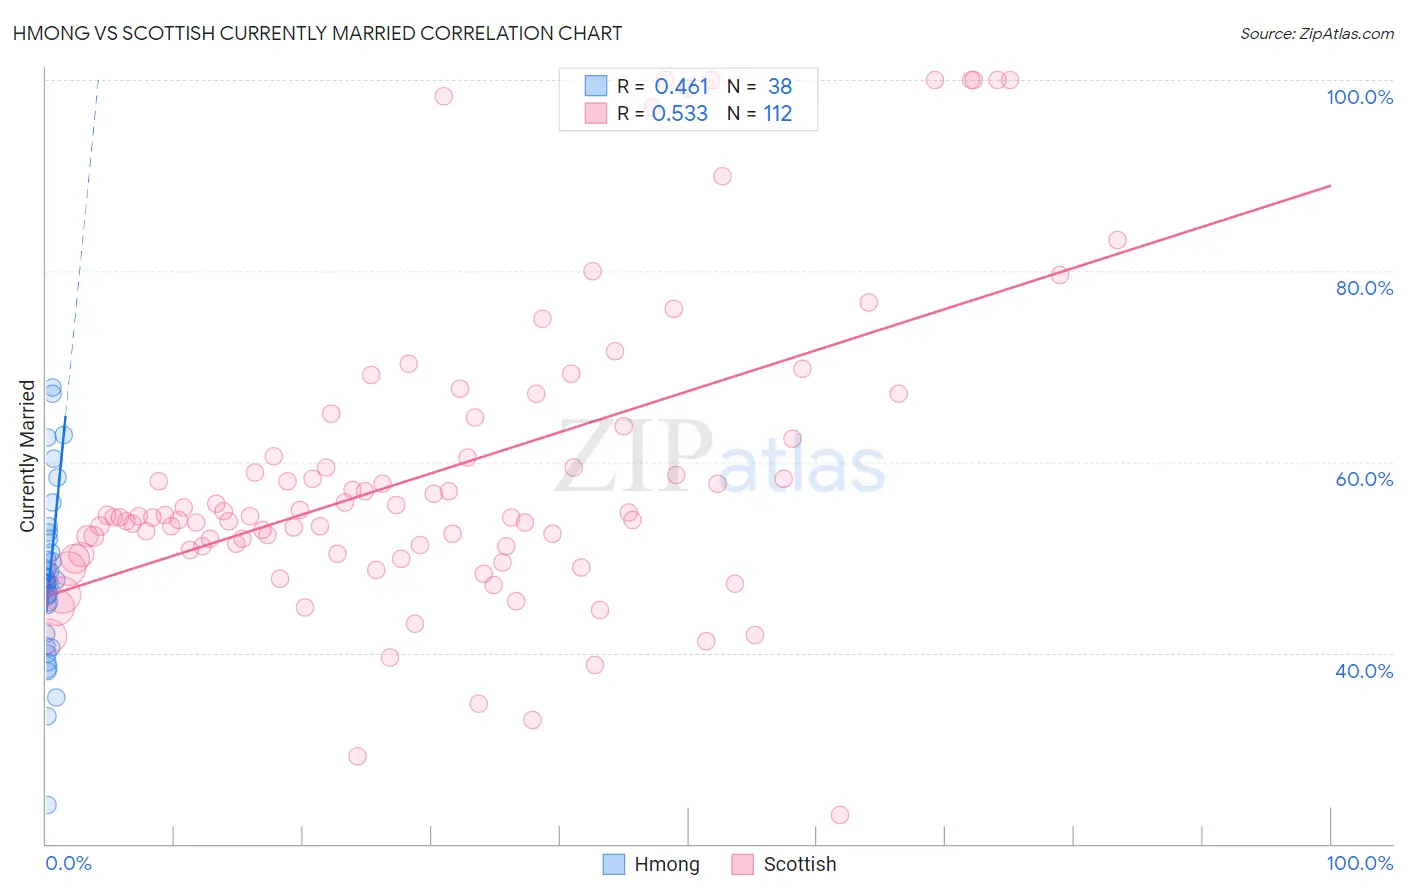
Hmong vs Scottish Currently Married Correlation Chart
The statistical analysis conducted on geographies consisting of 24,669,739 people shows a moderate positive correlation between the proportion of Hmong and percentage of population currently married in the United States with a correlation coefficient (R) of 0.461 and weighted average of 47.1%. Similarly, the statistical analysis conducted on geographies consisting of 567,020,693 people shows a substantial positive correlation between the proportion of Scottish and percentage of population currently married in the United States with a correlation coefficient (R) of 0.533 and weighted average of 49.2%, a difference of 4.6%.
Currently Married Correlation Summary
| Measurement | Hmong | Scottish |
| Minimum | 24.0% | 23.0% |
| Maximum | 67.8% | 100.0% |
| Range | 43.8% | 77.0% |
| Mean | 47.9% | 59.0% |
| Median | 47.4% | 54.2% |
| Interquartile 25% (IQ1) | 42.0% | 51.0% |
| Interquartile 75% (IQ3) | 52.0% | 63.0% |
| Interquartile Range (IQR) | 10.0% | 12.1% |
| Standard Deviation (Sample) | 9.1% | 16.3% |
| Standard Deviation (Population) | 9.0% | 16.2% |
Similar Demographics by Currently Married
Demographics Similar to Hmong by Currently Married
In terms of currently married, the demographic groups most similar to Hmong are Immigrants from South Eastern Asia (47.1%, a difference of 0.030%), Argentinean (47.1%, a difference of 0.040%), Guamanian/Chamorro (47.1%, a difference of 0.040%), Carpatho Rusyn (47.0%, a difference of 0.040%), and Venezuelan (47.1%, a difference of 0.050%).
| Demographics | Rating | Rank | Currently Married |
| Paraguayans | 77.8 /100 | #137 | Good 47.2% |
| Pakistanis | 77.5 /100 | #138 | Good 47.2% |
| Yugoslavians | 77.4 /100 | #139 | Good 47.2% |
| Cajuns | 75.3 /100 | #140 | Good 47.1% |
| Venezuelans | 74.4 /100 | #141 | Good 47.1% |
| Argentineans | 74.4 /100 | #142 | Good 47.1% |
| Guamanians/Chamorros | 74.2 /100 | #143 | Good 47.1% |
| Hmong | 73.4 /100 | #144 | Good 47.1% |
| Immigrants | South Eastern Asia | 72.9 /100 | #145 | Good 47.1% |
| Carpatho Rusyns | 72.6 /100 | #146 | Good 47.0% |
| Immigrants | Argentina | 72.0 /100 | #147 | Good 47.0% |
| Cambodians | 70.4 /100 | #148 | Good 47.0% |
| Zimbabweans | 70.1 /100 | #149 | Good 47.0% |
| Immigrants | Turkey | 70.0 /100 | #150 | Good 47.0% |
| Chileans | 69.8 /100 | #151 | Good 47.0% |
Demographics Similar to Scottish by Currently Married
In terms of currently married, the demographic groups most similar to Scottish are Luxembourger (49.3%, a difference of 0.11%), Bulgarian (49.1%, a difference of 0.22%), European (49.3%, a difference of 0.24%), Immigrants from Scotland (49.3%, a difference of 0.26%), and Immigrants from Pakistan (49.1%, a difference of 0.33%).
| Demographics | Rating | Rank | Currently Married |
| Germans | 99.9 /100 | #14 | Exceptional 49.6% |
| Pennsylvania Germans | 99.9 /100 | #15 | Exceptional 49.6% |
| Chinese | 99.9 /100 | #16 | Exceptional 49.5% |
| Scandinavians | 99.9 /100 | #17 | Exceptional 49.5% |
| Immigrants | Scotland | 99.8 /100 | #18 | Exceptional 49.3% |
| Europeans | 99.8 /100 | #19 | Exceptional 49.3% |
| Luxembourgers | 99.8 /100 | #20 | Exceptional 49.3% |
| Scottish | 99.8 /100 | #21 | Exceptional 49.2% |
| Bulgarians | 99.7 /100 | #22 | Exceptional 49.1% |
| Immigrants | Pakistan | 99.7 /100 | #23 | Exceptional 49.1% |
| Lithuanians | 99.6 /100 | #24 | Exceptional 49.0% |
| Maltese | 99.6 /100 | #25 | Exceptional 49.0% |
| Immigrants | Korea | 99.6 /100 | #26 | Exceptional 49.0% |
| Burmese | 99.6 /100 | #27 | Exceptional 48.9% |
| Welsh | 99.5 /100 | #28 | Exceptional 48.9% |