Hmong vs Immigrants from Morocco Master's Degree
COMPARE
Hmong
Immigrants from Morocco
Master's Degree
Master's Degree Comparison
Hmong
Immigrants from Morocco
13.4%
MASTER'S DEGREE
4.0/ 100
METRIC RATING
238th/ 347
METRIC RANK
17.1%
MASTER'S DEGREE
98.9/ 100
METRIC RATING
95th/ 347
METRIC RANK
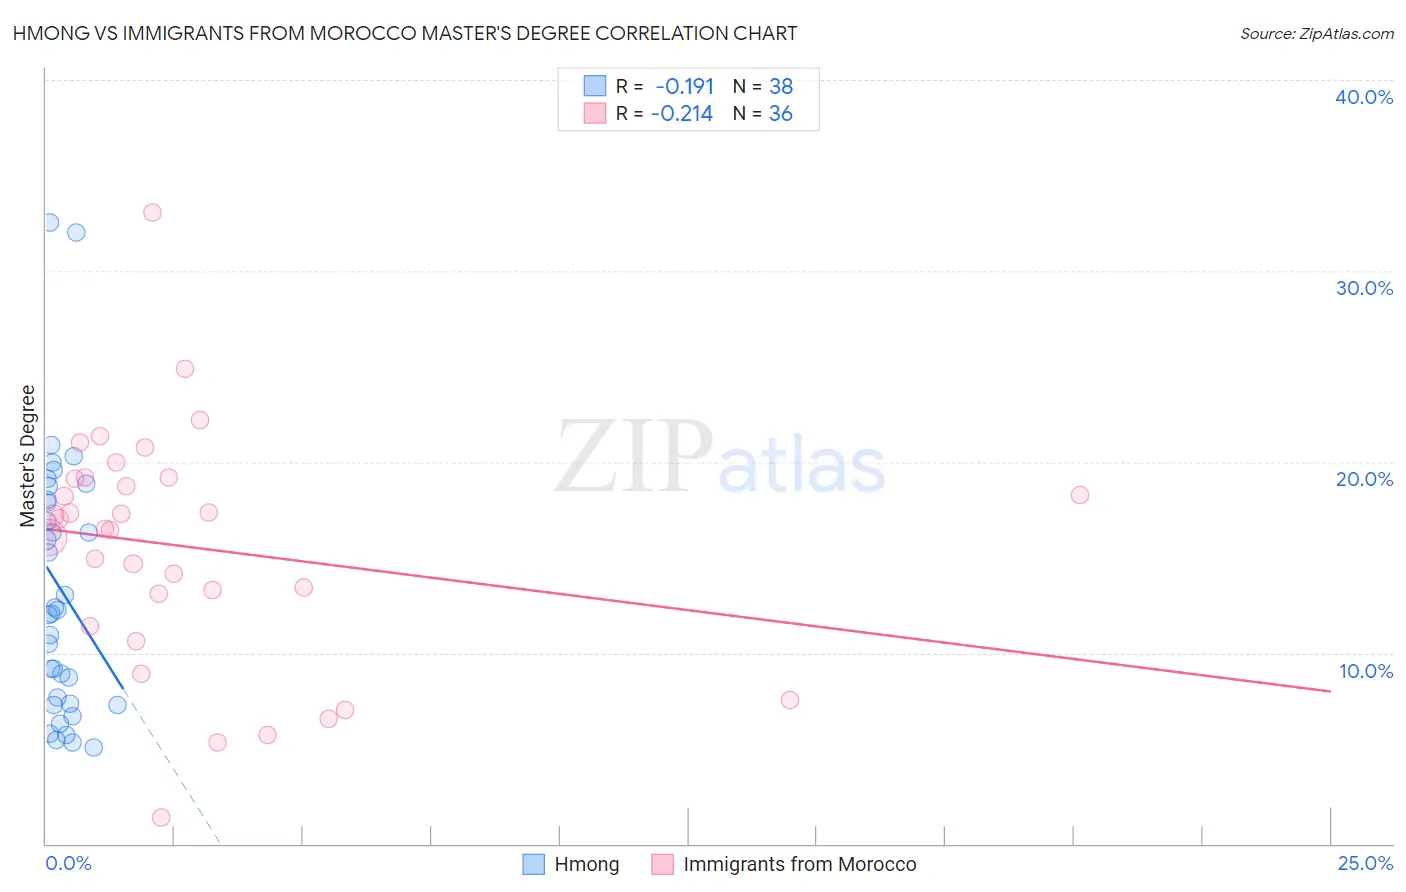
Hmong vs Immigrants from Morocco Master's Degree Correlation Chart
The statistical analysis conducted on geographies consisting of 24,664,732 people shows a poor negative correlation between the proportion of Hmong and percentage of population with at least master's degree education in the United States with a correlation coefficient (R) of -0.191 and weighted average of 13.4%. Similarly, the statistical analysis conducted on geographies consisting of 178,911,392 people shows a weak negative correlation between the proportion of Immigrants from Morocco and percentage of population with at least master's degree education in the United States with a correlation coefficient (R) of -0.214 and weighted average of 17.1%, a difference of 27.5%.
Master's Degree Correlation Summary
| Measurement | Hmong | Immigrants from Morocco |
| Minimum | 5.0% | 1.4% |
| Maximum | 32.5% | 33.1% |
| Range | 27.5% | 31.7% |
| Mean | 13.3% | 15.5% |
| Median | 12.1% | 16.8% |
| Interquartile 25% (IQ1) | 7.3% | 12.2% |
| Interquartile 75% (IQ3) | 18.0% | 19.1% |
| Interquartile Range (IQR) | 10.7% | 6.9% |
| Standard Deviation (Sample) | 6.8% | 6.2% |
| Standard Deviation (Population) | 6.7% | 6.1% |
Similar Demographics by Master's Degree
Demographics Similar to Hmong by Master's Degree
In terms of master's degree, the demographic groups most similar to Hmong are Jamaican (13.4%, a difference of 0.14%), Immigrants from Guyana (13.4%, a difference of 0.36%), German Russian (13.5%, a difference of 0.48%), Nonimmigrants (13.3%, a difference of 0.53%), and Immigrants from Burma/Myanmar (13.5%, a difference of 0.88%).
| Demographics | Rating | Rank | Master's Degree |
| Guyanese | 7.6 /100 | #231 | Tragic 13.7% |
| Immigrants | Philippines | 6.0 /100 | #232 | Tragic 13.6% |
| Immigrants | Ecuador | 5.7 /100 | #233 | Tragic 13.6% |
| Immigrants | Burma/Myanmar | 5.0 /100 | #234 | Tragic 13.5% |
| German Russians | 4.5 /100 | #235 | Tragic 13.5% |
| Immigrants | Guyana | 4.4 /100 | #236 | Tragic 13.4% |
| Jamaicans | 4.1 /100 | #237 | Tragic 13.4% |
| Hmong | 4.0 /100 | #238 | Tragic 13.4% |
| Immigrants | Nonimmigrants | 3.4 /100 | #239 | Tragic 13.3% |
| Guamanians/Chamorros | 2.2 /100 | #240 | Tragic 13.1% |
| U.S. Virgin Islanders | 2.1 /100 | #241 | Tragic 13.1% |
| Spanish Americans | 1.9 /100 | #242 | Tragic 13.0% |
| Immigrants | Jamaica | 1.9 /100 | #243 | Tragic 13.0% |
| Delaware | 1.7 /100 | #244 | Tragic 13.0% |
| Immigrants | Bahamas | 1.4 /100 | #245 | Tragic 12.9% |
Demographics Similar to Immigrants from Morocco by Master's Degree
In terms of master's degree, the demographic groups most similar to Immigrants from Morocco are Immigrants from Northern Africa (17.1%, a difference of 0.030%), Immigrants from England (17.0%, a difference of 0.19%), Immigrants from Ukraine (17.0%, a difference of 0.29%), Ugandan (17.1%, a difference of 0.32%), and Laotian (17.0%, a difference of 0.35%).
| Demographics | Rating | Rank | Master's Degree |
| Immigrants | Canada | 99.2 /100 | #88 | Exceptional 17.2% |
| Bhutanese | 99.1 /100 | #89 | Exceptional 17.2% |
| Immigrants | Egypt | 99.1 /100 | #90 | Exceptional 17.2% |
| Romanians | 99.1 /100 | #91 | Exceptional 17.2% |
| Immigrants | North America | 99.1 /100 | #92 | Exceptional 17.2% |
| Immigrants | Italy | 99.1 /100 | #93 | Exceptional 17.2% |
| Ugandans | 99.0 /100 | #94 | Exceptional 17.1% |
| Immigrants | Morocco | 98.9 /100 | #95 | Exceptional 17.1% |
| Immigrants | Northern Africa | 98.9 /100 | #96 | Exceptional 17.1% |
| Immigrants | England | 98.8 /100 | #97 | Exceptional 17.0% |
| Immigrants | Ukraine | 98.8 /100 | #98 | Exceptional 17.0% |
| Laotians | 98.8 /100 | #99 | Exceptional 17.0% |
| Albanians | 98.7 /100 | #100 | Exceptional 17.0% |
| Immigrants | Nepal | 98.6 /100 | #101 | Exceptional 17.0% |
| Chileans | 98.6 /100 | #102 | Exceptional 16.9% |