Hmong vs Immigrants from India Master's Degree
COMPARE
Hmong
Immigrants from India
Master's Degree
Master's Degree Comparison
Hmong
Immigrants from India
13.4%
MASTER'S DEGREE
4.0/ 100
METRIC RATING
238th/ 347
METRIC RANK
22.3%
MASTER'S DEGREE
100.0/ 100
METRIC RATING
6th/ 347
METRIC RANK
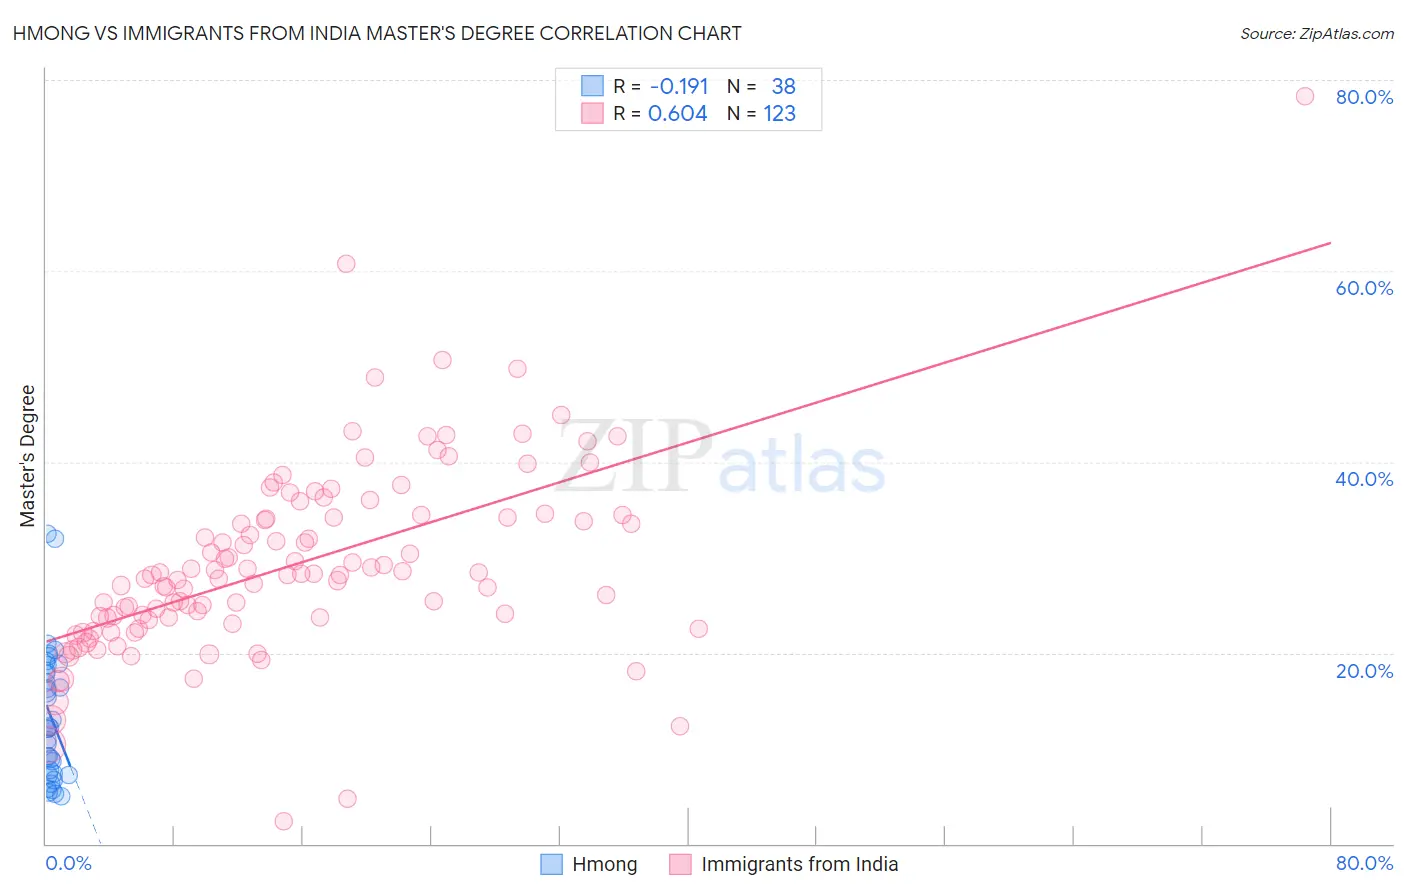
Hmong vs Immigrants from India Master's Degree Correlation Chart
The statistical analysis conducted on geographies consisting of 24,664,732 people shows a poor negative correlation between the proportion of Hmong and percentage of population with at least master's degree education in the United States with a correlation coefficient (R) of -0.191 and weighted average of 13.4%. Similarly, the statistical analysis conducted on geographies consisting of 433,961,661 people shows a significant positive correlation between the proportion of Immigrants from India and percentage of population with at least master's degree education in the United States with a correlation coefficient (R) of 0.604 and weighted average of 22.3%, a difference of 66.5%.
Master's Degree Correlation Summary
| Measurement | Hmong | Immigrants from India |
| Minimum | 5.0% | 2.4% |
| Maximum | 32.5% | 78.4% |
| Range | 27.5% | 76.0% |
| Mean | 13.3% | 29.2% |
| Median | 12.1% | 28.2% |
| Interquartile 25% (IQ1) | 7.3% | 23.4% |
| Interquartile 75% (IQ3) | 18.0% | 34.2% |
| Interquartile Range (IQR) | 10.7% | 10.8% |
| Standard Deviation (Sample) | 6.8% | 10.1% |
| Standard Deviation (Population) | 6.7% | 10.0% |
Similar Demographics by Master's Degree
Demographics Similar to Hmong by Master's Degree
In terms of master's degree, the demographic groups most similar to Hmong are Jamaican (13.4%, a difference of 0.14%), Immigrants from Guyana (13.4%, a difference of 0.36%), German Russian (13.5%, a difference of 0.48%), Nonimmigrants (13.3%, a difference of 0.53%), and Immigrants from Burma/Myanmar (13.5%, a difference of 0.88%).
| Demographics | Rating | Rank | Master's Degree |
| Guyanese | 7.6 /100 | #231 | Tragic 13.7% |
| Immigrants | Philippines | 6.0 /100 | #232 | Tragic 13.6% |
| Immigrants | Ecuador | 5.7 /100 | #233 | Tragic 13.6% |
| Immigrants | Burma/Myanmar | 5.0 /100 | #234 | Tragic 13.5% |
| German Russians | 4.5 /100 | #235 | Tragic 13.5% |
| Immigrants | Guyana | 4.4 /100 | #236 | Tragic 13.4% |
| Jamaicans | 4.1 /100 | #237 | Tragic 13.4% |
| Hmong | 4.0 /100 | #238 | Tragic 13.4% |
| Immigrants | Nonimmigrants | 3.4 /100 | #239 | Tragic 13.3% |
| Guamanians/Chamorros | 2.2 /100 | #240 | Tragic 13.1% |
| U.S. Virgin Islanders | 2.1 /100 | #241 | Tragic 13.1% |
| Spanish Americans | 1.9 /100 | #242 | Tragic 13.0% |
| Immigrants | Jamaica | 1.9 /100 | #243 | Tragic 13.0% |
| Delaware | 1.7 /100 | #244 | Tragic 13.0% |
| Immigrants | Bahamas | 1.4 /100 | #245 | Tragic 12.9% |
Demographics Similar to Immigrants from India by Master's Degree
In terms of master's degree, the demographic groups most similar to Immigrants from India are Iranian (22.3%, a difference of 0.21%), Immigrants from Taiwan (22.5%, a difference of 0.68%), Immigrants from Israel (22.6%, a difference of 1.5%), Okinawan (22.6%, a difference of 1.5%), and Cypriot (21.8%, a difference of 2.4%).
| Demographics | Rating | Rank | Master's Degree |
| Immigrants | Singapore | 100.0 /100 | #1 | Exceptional 23.4% |
| Filipinos | 100.0 /100 | #2 | Exceptional 23.4% |
| Immigrants | Israel | 100.0 /100 | #3 | Exceptional 22.6% |
| Okinawans | 100.0 /100 | #4 | Exceptional 22.6% |
| Immigrants | Taiwan | 100.0 /100 | #5 | Exceptional 22.5% |
| Immigrants | India | 100.0 /100 | #6 | Exceptional 22.3% |
| Iranians | 100.0 /100 | #7 | Exceptional 22.3% |
| Cypriots | 100.0 /100 | #8 | Exceptional 21.8% |
| Thais | 100.0 /100 | #9 | Exceptional 21.7% |
| Immigrants | Iran | 100.0 /100 | #10 | Exceptional 21.6% |
| Immigrants | China | 100.0 /100 | #11 | Exceptional 21.2% |
| Eastern Europeans | 100.0 /100 | #12 | Exceptional 21.1% |
| Immigrants | Australia | 100.0 /100 | #13 | Exceptional 20.9% |
| Immigrants | Switzerland | 100.0 /100 | #14 | Exceptional 20.9% |
| Immigrants | Eastern Asia | 100.0 /100 | #15 | Exceptional 20.8% |