Hmong vs Ukrainian Master's Degree
COMPARE
Hmong
Ukrainian
Master's Degree
Master's Degree Comparison
Hmong
Ukrainians
13.4%
MASTER'S DEGREE
4.0/ 100
METRIC RATING
238th/ 347
METRIC RANK
16.9%
MASTER'S DEGREE
98.3/ 100
METRIC RATING
104th/ 347
METRIC RANK
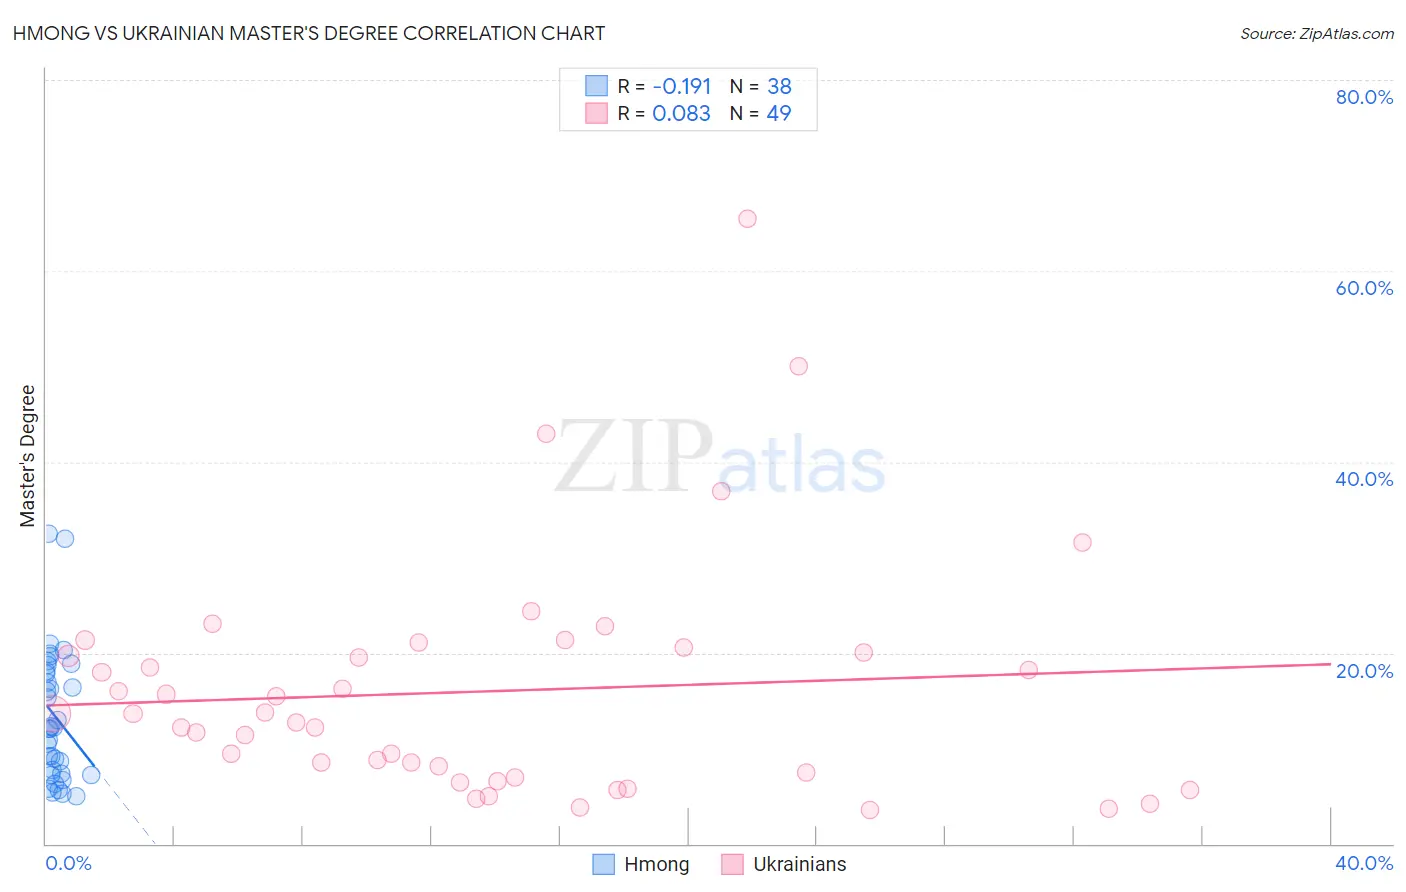
Hmong vs Ukrainian Master's Degree Correlation Chart
The statistical analysis conducted on geographies consisting of 24,664,732 people shows a poor negative correlation between the proportion of Hmong and percentage of population with at least master's degree education in the United States with a correlation coefficient (R) of -0.191 and weighted average of 13.4%. Similarly, the statistical analysis conducted on geographies consisting of 448,518,691 people shows a slight positive correlation between the proportion of Ukrainians and percentage of population with at least master's degree education in the United States with a correlation coefficient (R) of 0.083 and weighted average of 16.9%, a difference of 25.9%.
Master's Degree Correlation Summary
| Measurement | Hmong | Ukrainian |
| Minimum | 5.0% | 3.6% |
| Maximum | 32.5% | 65.5% |
| Range | 27.5% | 61.9% |
| Mean | 13.3% | 16.0% |
| Median | 12.1% | 13.6% |
| Interquartile 25% (IQ1) | 7.3% | 7.2% |
| Interquartile 75% (IQ3) | 18.0% | 20.3% |
| Interquartile Range (IQR) | 10.7% | 13.1% |
| Standard Deviation (Sample) | 6.8% | 12.3% |
| Standard Deviation (Population) | 6.7% | 12.2% |
Similar Demographics by Master's Degree
Demographics Similar to Hmong by Master's Degree
In terms of master's degree, the demographic groups most similar to Hmong are Jamaican (13.4%, a difference of 0.14%), Immigrants from Guyana (13.4%, a difference of 0.36%), German Russian (13.5%, a difference of 0.48%), Nonimmigrants (13.3%, a difference of 0.53%), and Immigrants from Burma/Myanmar (13.5%, a difference of 0.88%).
| Demographics | Rating | Rank | Master's Degree |
| Guyanese | 7.6 /100 | #231 | Tragic 13.7% |
| Immigrants | Philippines | 6.0 /100 | #232 | Tragic 13.6% |
| Immigrants | Ecuador | 5.7 /100 | #233 | Tragic 13.6% |
| Immigrants | Burma/Myanmar | 5.0 /100 | #234 | Tragic 13.5% |
| German Russians | 4.5 /100 | #235 | Tragic 13.5% |
| Immigrants | Guyana | 4.4 /100 | #236 | Tragic 13.4% |
| Jamaicans | 4.1 /100 | #237 | Tragic 13.4% |
| Hmong | 4.0 /100 | #238 | Tragic 13.4% |
| Immigrants | Nonimmigrants | 3.4 /100 | #239 | Tragic 13.3% |
| Guamanians/Chamorros | 2.2 /100 | #240 | Tragic 13.1% |
| U.S. Virgin Islanders | 2.1 /100 | #241 | Tragic 13.1% |
| Spanish Americans | 1.9 /100 | #242 | Tragic 13.0% |
| Immigrants | Jamaica | 1.9 /100 | #243 | Tragic 13.0% |
| Delaware | 1.7 /100 | #244 | Tragic 13.0% |
| Immigrants | Bahamas | 1.4 /100 | #245 | Tragic 12.9% |
Demographics Similar to Ukrainians by Master's Degree
In terms of master's degree, the demographic groups most similar to Ukrainians are Syrian (16.8%, a difference of 0.10%), Alsatian (16.9%, a difference of 0.12%), Immigrants from Albania (16.8%, a difference of 0.38%), Chilean (16.9%, a difference of 0.45%), and Armenian (16.8%, a difference of 0.47%).
| Demographics | Rating | Rank | Master's Degree |
| Immigrants | England | 98.8 /100 | #97 | Exceptional 17.0% |
| Immigrants | Ukraine | 98.8 /100 | #98 | Exceptional 17.0% |
| Laotians | 98.8 /100 | #99 | Exceptional 17.0% |
| Albanians | 98.7 /100 | #100 | Exceptional 17.0% |
| Immigrants | Nepal | 98.6 /100 | #101 | Exceptional 17.0% |
| Chileans | 98.6 /100 | #102 | Exceptional 16.9% |
| Alsatians | 98.4 /100 | #103 | Exceptional 16.9% |
| Ukrainians | 98.3 /100 | #104 | Exceptional 16.9% |
| Syrians | 98.3 /100 | #105 | Exceptional 16.8% |
| Immigrants | Albania | 98.1 /100 | #106 | Exceptional 16.8% |
| Armenians | 98.0 /100 | #107 | Exceptional 16.8% |
| Sierra Leoneans | 98.0 /100 | #108 | Exceptional 16.8% |
| Moroccans | 98.0 /100 | #109 | Exceptional 16.8% |
| Immigrants | Chile | 98.0 /100 | #110 | Exceptional 16.8% |
| Austrians | 97.8 /100 | #111 | Exceptional 16.7% |