Alaskan Athabascan vs Immigrants from Sudan 10th Grade
COMPARE
Alaskan Athabascan
Immigrants from Sudan
10th Grade
10th Grade Comparison
Alaskan Athabascans
Immigrants from Sudan
95.4%
10TH GRADE
100.0/ 100
METRIC RATING
27th/ 347
METRIC RANK
93.4%
10TH GRADE
20.0/ 100
METRIC RATING
206th/ 347
METRIC RANK
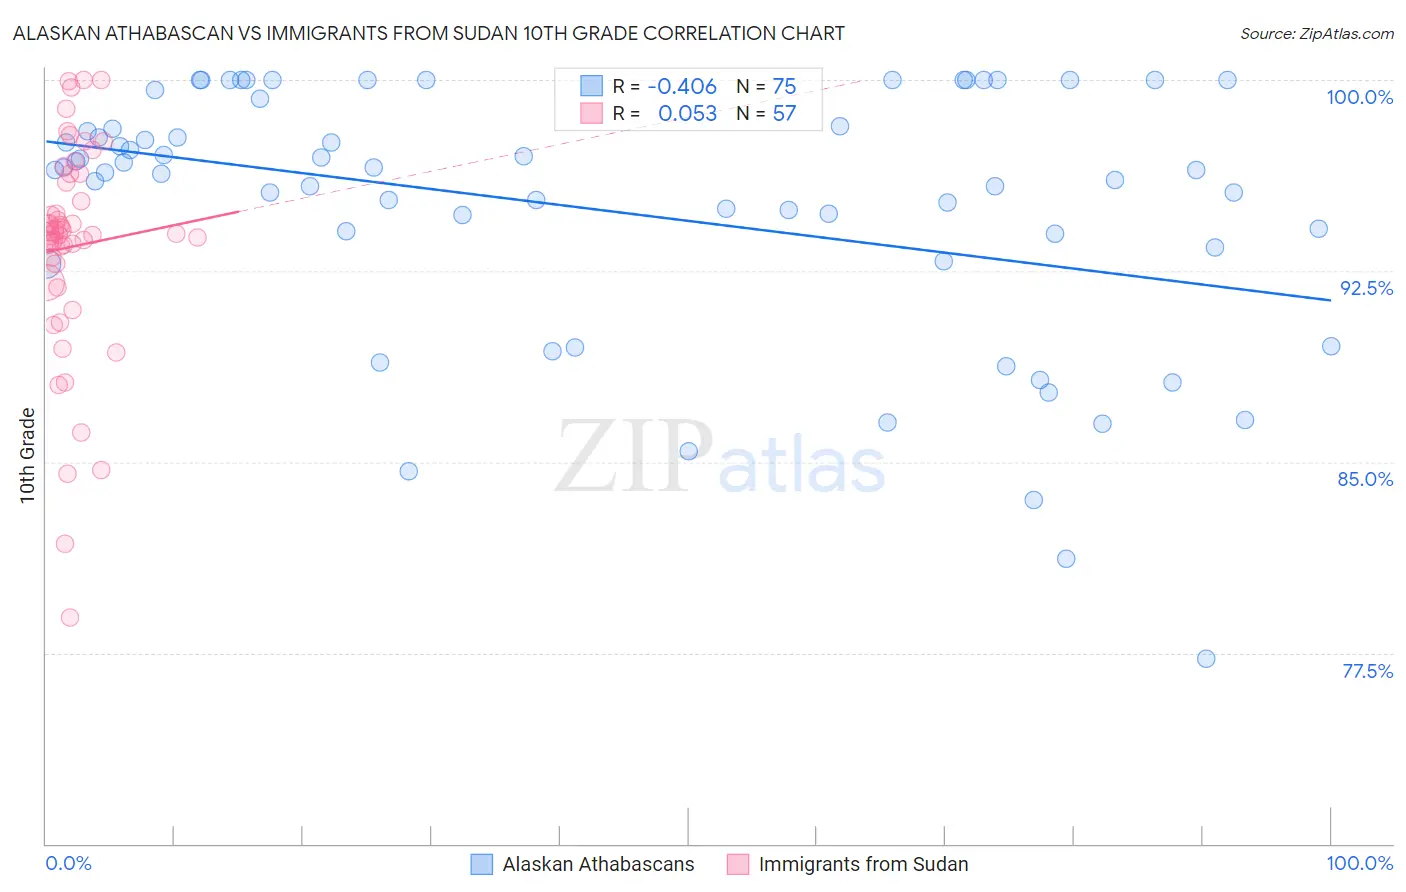
Alaskan Athabascan vs Immigrants from Sudan 10th Grade Correlation Chart
The statistical analysis conducted on geographies consisting of 45,820,444 people shows a moderate negative correlation between the proportion of Alaskan Athabascans and percentage of population with at least 10th grade education in the United States with a correlation coefficient (R) of -0.406 and weighted average of 95.4%. Similarly, the statistical analysis conducted on geographies consisting of 118,959,807 people shows a slight positive correlation between the proportion of Immigrants from Sudan and percentage of population with at least 10th grade education in the United States with a correlation coefficient (R) of 0.053 and weighted average of 93.4%, a difference of 2.1%.
10th Grade Correlation Summary
| Measurement | Alaskan Athabascan | Immigrants from Sudan |
| Minimum | 77.3% | 78.9% |
| Maximum | 100.0% | 100.0% |
| Range | 22.7% | 21.1% |
| Mean | 94.9% | 93.5% |
| Median | 96.4% | 94.0% |
| Interquartile 25% (IQ1) | 93.4% | 92.4% |
| Interquartile 75% (IQ3) | 98.2% | 96.1% |
| Interquartile Range (IQR) | 4.8% | 3.7% |
| Standard Deviation (Sample) | 5.1% | 4.3% |
| Standard Deviation (Population) | 5.1% | 4.2% |
Similar Demographics by 10th Grade
Demographics Similar to Alaskan Athabascans by 10th Grade
In terms of 10th grade, the demographic groups most similar to Alaskan Athabascans are Luxembourger (95.4%, a difference of 0.0%), Welsh (95.5%, a difference of 0.020%), Bulgarian (95.4%, a difference of 0.030%), European (95.5%, a difference of 0.040%), and Maltese (95.5%, a difference of 0.040%).
| Demographics | Rating | Rank | 10th Grade |
| Chinese | 100.0 /100 | #20 | Exceptional 95.5% |
| Dutch | 100.0 /100 | #21 | Exceptional 95.5% |
| Eastern Europeans | 100.0 /100 | #22 | Exceptional 95.5% |
| Czechs | 100.0 /100 | #23 | Exceptional 95.5% |
| Europeans | 100.0 /100 | #24 | Exceptional 95.5% |
| Maltese | 100.0 /100 | #25 | Exceptional 95.5% |
| Welsh | 100.0 /100 | #26 | Exceptional 95.5% |
| Alaskan Athabascans | 100.0 /100 | #27 | Exceptional 95.4% |
| Luxembourgers | 100.0 /100 | #28 | Exceptional 95.4% |
| Bulgarians | 100.0 /100 | #29 | Exceptional 95.4% |
| Belgians | 100.0 /100 | #30 | Exceptional 95.4% |
| Iranians | 100.0 /100 | #31 | Exceptional 95.3% |
| Hungarians | 100.0 /100 | #32 | Exceptional 95.3% |
| French | 100.0 /100 | #33 | Exceptional 95.3% |
| British | 99.9 /100 | #34 | Exceptional 95.3% |
Demographics Similar to Immigrants from Sudan by 10th Grade
In terms of 10th grade, the demographic groups most similar to Immigrants from Sudan are Ute (93.4%, a difference of 0.0%), Immigrants from Indonesia (93.4%, a difference of 0.0%), Immigrants from Uganda (93.5%, a difference of 0.010%), Immigrants from Western Asia (93.4%, a difference of 0.010%), and Samoan (93.4%, a difference of 0.010%).
| Demographics | Rating | Rank | 10th Grade |
| Asians | 23.0 /100 | #199 | Fair 93.5% |
| Hopi | 22.2 /100 | #200 | Fair 93.5% |
| Hawaiians | 21.8 /100 | #201 | Fair 93.5% |
| Immigrants | Uganda | 20.9 /100 | #202 | Fair 93.5% |
| Immigrants | Western Asia | 20.6 /100 | #203 | Fair 93.4% |
| Ute | 20.3 /100 | #204 | Fair 93.4% |
| Immigrants | Indonesia | 20.2 /100 | #205 | Fair 93.4% |
| Immigrants | Sudan | 20.0 /100 | #206 | Fair 93.4% |
| Samoans | 19.5 /100 | #207 | Poor 93.4% |
| Immigrants | Syria | 19.4 /100 | #208 | Poor 93.4% |
| Immigrants | Chile | 18.8 /100 | #209 | Poor 93.4% |
| Indians (Asian) | 17.6 /100 | #210 | Poor 93.4% |
| Cajuns | 16.9 /100 | #211 | Poor 93.4% |
| Immigrants | Zaire | 16.7 /100 | #212 | Poor 93.4% |
| Immigrants | Asia | 15.7 /100 | #213 | Poor 93.4% |