Immigrants from Sri Lanka vs Immigrants from Sudan 10th Grade
COMPARE
Immigrants from Sri Lanka
Immigrants from Sudan
10th Grade
10th Grade Comparison
Immigrants from Sri Lanka
Immigrants from Sudan
94.2%
10TH GRADE
89.9/ 100
METRIC RATING
138th/ 347
METRIC RANK
93.4%
10TH GRADE
20.0/ 100
METRIC RATING
206th/ 347
METRIC RANK
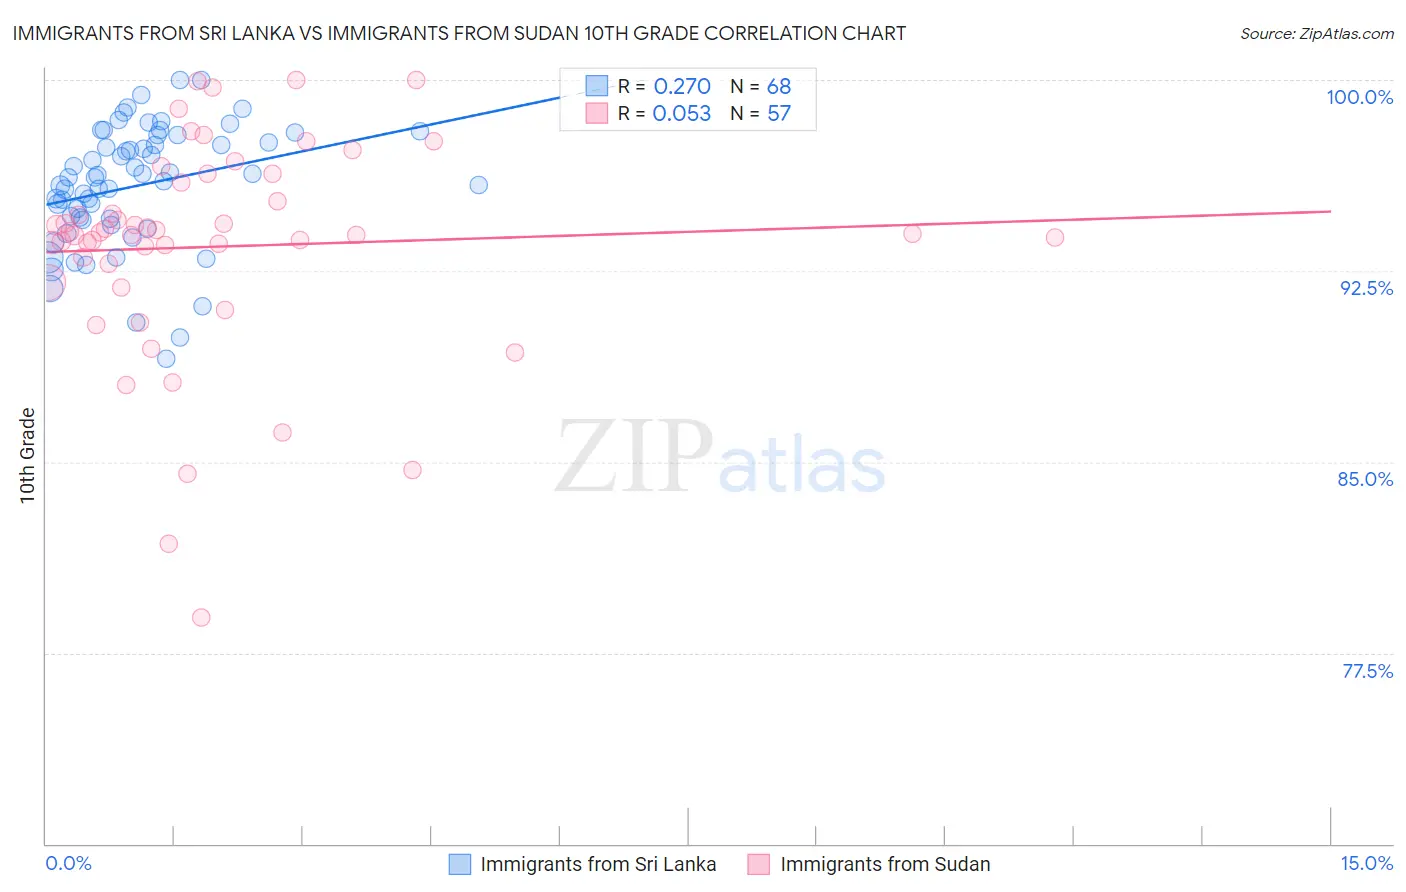
Immigrants from Sri Lanka vs Immigrants from Sudan 10th Grade Correlation Chart
The statistical analysis conducted on geographies consisting of 149,660,761 people shows a weak positive correlation between the proportion of Immigrants from Sri Lanka and percentage of population with at least 10th grade education in the United States with a correlation coefficient (R) of 0.270 and weighted average of 94.2%. Similarly, the statistical analysis conducted on geographies consisting of 118,959,807 people shows a slight positive correlation between the proportion of Immigrants from Sudan and percentage of population with at least 10th grade education in the United States with a correlation coefficient (R) of 0.053 and weighted average of 93.4%, a difference of 0.80%.
10th Grade Correlation Summary
| Measurement | Immigrants from Sri Lanka | Immigrants from Sudan |
| Minimum | 89.0% | 78.9% |
| Maximum | 100.0% | 100.0% |
| Range | 11.0% | 21.1% |
| Mean | 95.8% | 93.5% |
| Median | 96.2% | 94.0% |
| Interquartile 25% (IQ1) | 94.5% | 92.4% |
| Interquartile 75% (IQ3) | 97.7% | 96.1% |
| Interquartile Range (IQR) | 3.2% | 3.7% |
| Standard Deviation (Sample) | 2.4% | 4.3% |
| Standard Deviation (Population) | 2.4% | 4.2% |
Similar Demographics by 10th Grade
Demographics Similar to Immigrants from Sri Lanka by 10th Grade
In terms of 10th grade, the demographic groups most similar to Immigrants from Sri Lanka are Arapaho (94.2%, a difference of 0.010%), Immigrants from Bosnia and Herzegovina (94.2%, a difference of 0.010%), Shoshone (94.2%, a difference of 0.020%), Immigrants from Korea (94.2%, a difference of 0.040%), and Creek (94.2%, a difference of 0.050%).
| Demographics | Rating | Rank | 10th Grade |
| Immigrants | Eastern Europe | 92.5 /100 | #131 | Exceptional 94.3% |
| Immigrants | Russia | 92.4 /100 | #132 | Exceptional 94.3% |
| Creek | 91.9 /100 | #133 | Exceptional 94.2% |
| Osage | 91.7 /100 | #134 | Exceptional 94.2% |
| Immigrants | Korea | 91.3 /100 | #135 | Exceptional 94.2% |
| Shoshone | 90.8 /100 | #136 | Exceptional 94.2% |
| Arapaho | 90.5 /100 | #137 | Exceptional 94.2% |
| Immigrants | Sri Lanka | 89.9 /100 | #138 | Excellent 94.2% |
| Immigrants | Bosnia and Herzegovina | 89.4 /100 | #139 | Excellent 94.2% |
| Immigrants | Jordan | 87.6 /100 | #140 | Excellent 94.1% |
| Hmong | 86.6 /100 | #141 | Excellent 94.1% |
| Albanians | 86.5 /100 | #142 | Excellent 94.1% |
| Cherokee | 84.9 /100 | #143 | Excellent 94.1% |
| Immigrants | Kazakhstan | 84.9 /100 | #144 | Excellent 94.1% |
| Immigrants | Nonimmigrants | 83.8 /100 | #145 | Excellent 94.1% |
Demographics Similar to Immigrants from Sudan by 10th Grade
In terms of 10th grade, the demographic groups most similar to Immigrants from Sudan are Ute (93.4%, a difference of 0.0%), Immigrants from Indonesia (93.4%, a difference of 0.0%), Immigrants from Uganda (93.5%, a difference of 0.010%), Immigrants from Western Asia (93.4%, a difference of 0.010%), and Samoan (93.4%, a difference of 0.010%).
| Demographics | Rating | Rank | 10th Grade |
| Asians | 23.0 /100 | #199 | Fair 93.5% |
| Hopi | 22.2 /100 | #200 | Fair 93.5% |
| Hawaiians | 21.8 /100 | #201 | Fair 93.5% |
| Immigrants | Uganda | 20.9 /100 | #202 | Fair 93.5% |
| Immigrants | Western Asia | 20.6 /100 | #203 | Fair 93.4% |
| Ute | 20.3 /100 | #204 | Fair 93.4% |
| Immigrants | Indonesia | 20.2 /100 | #205 | Fair 93.4% |
| Immigrants | Sudan | 20.0 /100 | #206 | Fair 93.4% |
| Samoans | 19.5 /100 | #207 | Poor 93.4% |
| Immigrants | Syria | 19.4 /100 | #208 | Poor 93.4% |
| Immigrants | Chile | 18.8 /100 | #209 | Poor 93.4% |
| Indians (Asian) | 17.6 /100 | #210 | Poor 93.4% |
| Cajuns | 16.9 /100 | #211 | Poor 93.4% |
| Immigrants | Zaire | 16.7 /100 | #212 | Poor 93.4% |
| Immigrants | Asia | 15.7 /100 | #213 | Poor 93.4% |