Immigrants from Poland vs Immigrants from Philippines 10th Grade
COMPARE
Immigrants from Poland
Immigrants from Philippines
10th Grade
10th Grade Comparison
Immigrants from Poland
Immigrants from Philippines
93.9%
10TH GRADE
69.6/ 100
METRIC RATING
162nd/ 347
METRIC RANK
92.6%
10TH GRADE
0.4/ 100
METRIC RATING
266th/ 347
METRIC RANK
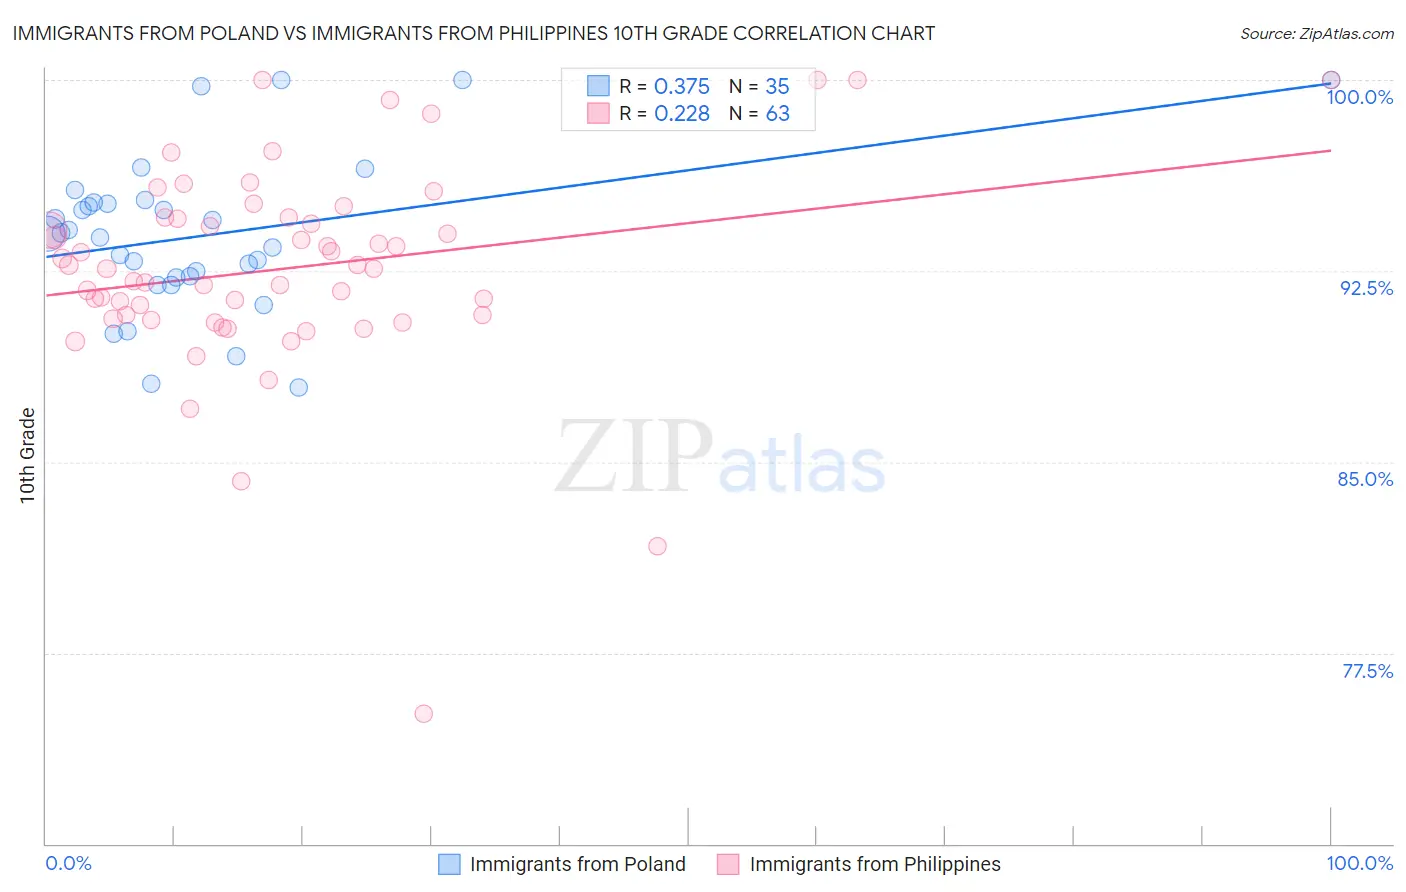
Immigrants from Poland vs Immigrants from Philippines 10th Grade Correlation Chart
The statistical analysis conducted on geographies consisting of 304,861,877 people shows a mild positive correlation between the proportion of Immigrants from Poland and percentage of population with at least 10th grade education in the United States with a correlation coefficient (R) of 0.375 and weighted average of 93.9%. Similarly, the statistical analysis conducted on geographies consisting of 471,300,535 people shows a weak positive correlation between the proportion of Immigrants from Philippines and percentage of population with at least 10th grade education in the United States with a correlation coefficient (R) of 0.228 and weighted average of 92.6%, a difference of 1.5%.
10th Grade Correlation Summary
| Measurement | Immigrants from Poland | Immigrants from Philippines |
| Minimum | 87.9% | 75.1% |
| Maximum | 100.0% | 100.0% |
| Range | 12.1% | 24.9% |
| Mean | 93.9% | 92.6% |
| Median | 94.0% | 92.6% |
| Interquartile 25% (IQ1) | 92.3% | 90.6% |
| Interquartile 75% (IQ3) | 95.2% | 94.6% |
| Interquartile Range (IQR) | 2.9% | 4.0% |
| Standard Deviation (Sample) | 3.1% | 4.1% |
| Standard Deviation (Population) | 3.0% | 4.1% |
Similar Demographics by 10th Grade
Demographics Similar to Immigrants from Poland by 10th Grade
In terms of 10th grade, the demographic groups most similar to Immigrants from Poland are Assyrian/Chaldean/Syriac (93.9%, a difference of 0.0%), Venezuelan (93.9%, a difference of 0.0%), Chilean (93.9%, a difference of 0.010%), Pakistani (93.9%, a difference of 0.010%), and Bermudan (93.9%, a difference of 0.020%).
| Demographics | Rating | Rank | 10th Grade |
| Spanish | 74.9 /100 | #155 | Good 94.0% |
| Mongolians | 74.4 /100 | #156 | Good 94.0% |
| Kiowa | 73.3 /100 | #157 | Good 93.9% |
| Bermudans | 71.0 /100 | #158 | Good 93.9% |
| Chileans | 70.2 /100 | #159 | Good 93.9% |
| Pakistanis | 70.1 /100 | #160 | Good 93.9% |
| Assyrians/Chaldeans/Syriacs | 69.7 /100 | #161 | Good 93.9% |
| Immigrants | Poland | 69.6 /100 | #162 | Good 93.9% |
| Venezuelans | 69.5 /100 | #163 | Good 93.9% |
| Iraqis | 68.1 /100 | #164 | Good 93.9% |
| Brazilians | 63.6 /100 | #165 | Good 93.8% |
| Immigrants | Iraq | 63.0 /100 | #166 | Good 93.8% |
| Immigrants | Egypt | 62.3 /100 | #167 | Good 93.8% |
| Alsatians | 59.4 /100 | #168 | Average 93.8% |
| Immigrants | Spain | 55.9 /100 | #169 | Average 93.8% |
Demographics Similar to Immigrants from Philippines by 10th Grade
In terms of 10th grade, the demographic groups most similar to Immigrants from Philippines are Dutch West Indian (92.6%, a difference of 0.0%), Taiwanese (92.5%, a difference of 0.010%), Immigrants from Ghana (92.5%, a difference of 0.010%), Immigrants from South America (92.6%, a difference of 0.030%), and Apache (92.6%, a difference of 0.030%).
| Demographics | Rating | Rank | 10th Grade |
| Immigrants | Jamaica | 0.5 /100 | #259 | Tragic 92.6% |
| Immigrants | Uzbekistan | 0.5 /100 | #260 | Tragic 92.6% |
| Paiute | 0.4 /100 | #261 | Tragic 92.6% |
| Immigrants | South America | 0.4 /100 | #262 | Tragic 92.6% |
| Apache | 0.4 /100 | #263 | Tragic 92.6% |
| Peruvians | 0.4 /100 | #264 | Tragic 92.6% |
| Dutch West Indians | 0.4 /100 | #265 | Tragic 92.6% |
| Immigrants | Philippines | 0.4 /100 | #266 | Tragic 92.6% |
| Taiwanese | 0.3 /100 | #267 | Tragic 92.5% |
| Immigrants | Ghana | 0.3 /100 | #268 | Tragic 92.5% |
| Immigrants | Colombia | 0.3 /100 | #269 | Tragic 92.5% |
| Immigrants | Uruguay | 0.3 /100 | #270 | Tragic 92.5% |
| Immigrants | Eritrea | 0.3 /100 | #271 | Tragic 92.5% |
| Immigrants | Western Africa | 0.3 /100 | #272 | Tragic 92.5% |
| Trinidadians and Tobagonians | 0.2 /100 | #273 | Tragic 92.4% |