Hmong vs Immigrants from Philippines Bachelor's Degree
COMPARE
Hmong
Immigrants from Philippines
Bachelor's Degree
Bachelor's Degree Comparison
Hmong
Immigrants from Philippines
34.8%
BACHELOR'S DEGREE
3.4/ 100
METRIC RATING
232nd/ 347
METRIC RANK
36.4%
BACHELOR'S DEGREE
17.8/ 100
METRIC RATING
212th/ 347
METRIC RANK
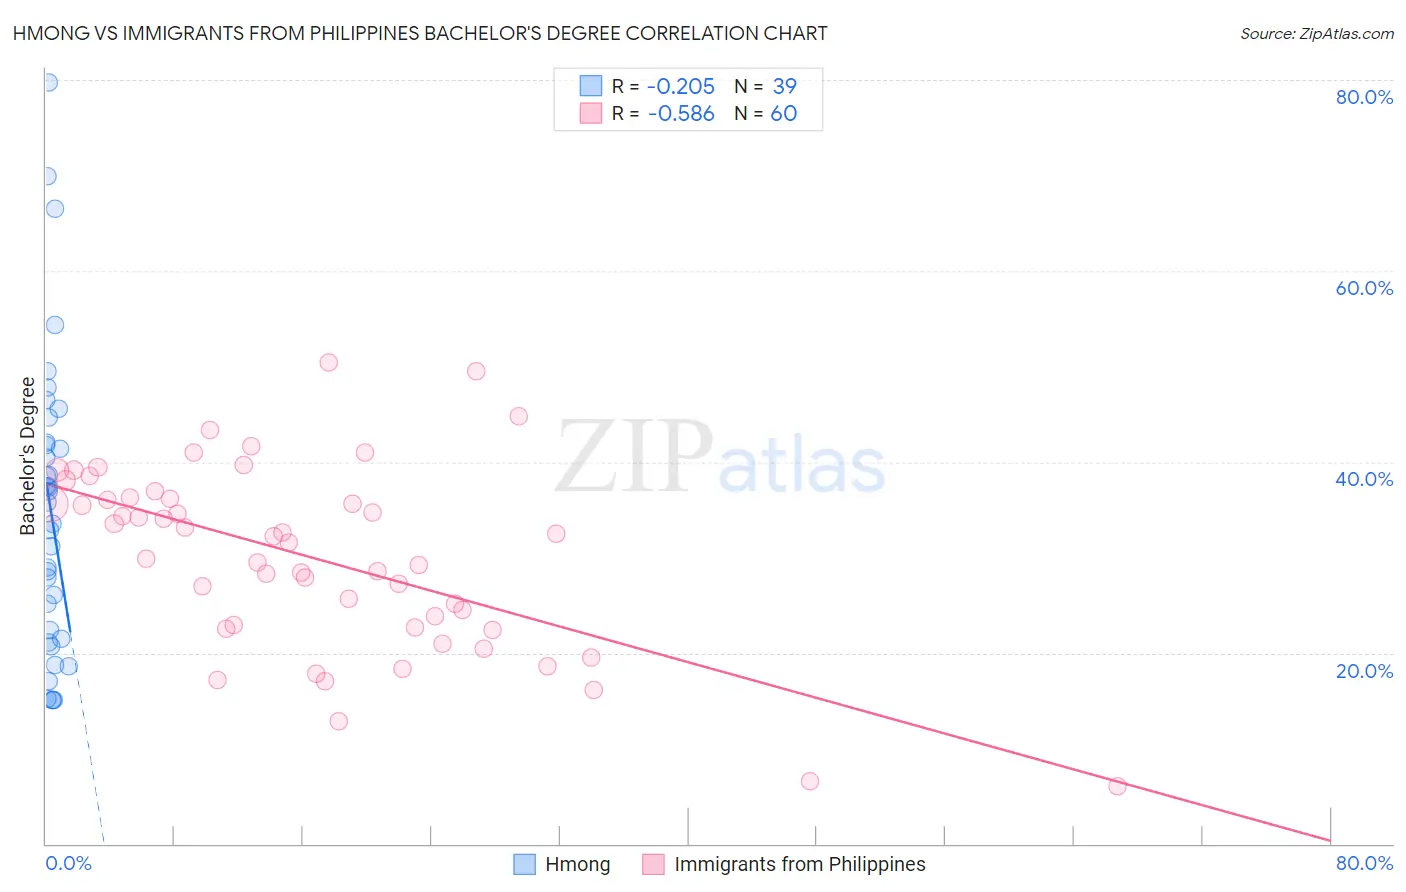
Hmong vs Immigrants from Philippines Bachelor's Degree Correlation Chart
The statistical analysis conducted on geographies consisting of 24,680,511 people shows a weak negative correlation between the proportion of Hmong and percentage of population with at least bachelor's degree education in the United States with a correlation coefficient (R) of -0.205 and weighted average of 34.8%. Similarly, the statistical analysis conducted on geographies consisting of 471,284,617 people shows a substantial negative correlation between the proportion of Immigrants from Philippines and percentage of population with at least bachelor's degree education in the United States with a correlation coefficient (R) of -0.586 and weighted average of 36.4%, a difference of 4.8%.
Bachelor's Degree Correlation Summary
| Measurement | Hmong | Immigrants from Philippines |
| Minimum | 15.0% | 6.0% |
| Maximum | 79.7% | 50.4% |
| Range | 64.7% | 44.4% |
| Mean | 35.0% | 30.0% |
| Median | 35.8% | 31.9% |
| Interquartile 25% (IQ1) | 21.5% | 22.8% |
| Interquartile 75% (IQ3) | 42.0% | 36.2% |
| Interquartile Range (IQR) | 20.5% | 13.4% |
| Standard Deviation (Sample) | 15.4% | 9.6% |
| Standard Deviation (Population) | 15.2% | 9.5% |
Demographics Similar to Hmong and Immigrants from Philippines by Bachelor's Degree
In terms of bachelor's degree, the demographic groups most similar to Hmong are Immigrants from St. Vincent and the Grenadines (35.0%, a difference of 0.63%), Immigrants from Grenada (35.0%, a difference of 0.65%), White/Caucasian (35.3%, a difference of 1.5%), Immigrants from Trinidad and Tobago (35.3%, a difference of 1.6%), and Ecuadorian (35.4%, a difference of 1.8%). Similarly, the demographic groups most similar to Immigrants from Philippines are Immigrants from Panama (36.2%, a difference of 0.68%), German (36.1%, a difference of 0.75%), Immigrants from Western Africa (36.1%, a difference of 0.78%), Barbadian (36.1%, a difference of 0.84%), and German Russian (35.8%, a difference of 1.7%).
| Demographics | Rating | Rank | Bachelor's Degree |
| Immigrants | Philippines | 17.8 /100 | #212 | Poor 36.4% |
| Immigrants | Panama | 14.2 /100 | #213 | Poor 36.2% |
| Germans | 13.9 /100 | #214 | Poor 36.1% |
| Immigrants | Western Africa | 13.8 /100 | #215 | Poor 36.1% |
| Barbadians | 13.5 /100 | #216 | Poor 36.1% |
| German Russians | 10.2 /100 | #217 | Poor 35.8% |
| Sub-Saharan Africans | 9.8 /100 | #218 | Tragic 35.8% |
| West Indians | 9.7 /100 | #219 | Tragic 35.8% |
| Spanish | 9.6 /100 | #220 | Tragic 35.8% |
| Dutch | 9.2 /100 | #221 | Tragic 35.7% |
| Trinidadians and Tobagonians | 8.8 /100 | #222 | Tragic 35.7% |
| French Canadians | 8.3 /100 | #223 | Tragic 35.6% |
| Immigrants | Barbados | 7.5 /100 | #224 | Tragic 35.5% |
| Immigrants | Burma/Myanmar | 7.3 /100 | #225 | Tragic 35.5% |
| Portuguese | 7.2 /100 | #226 | Tragic 35.5% |
| Ecuadorians | 6.6 /100 | #227 | Tragic 35.4% |
| Immigrants | Trinidad and Tobago | 6.0 /100 | #228 | Tragic 35.3% |
| Whites/Caucasians | 5.9 /100 | #229 | Tragic 35.3% |
| Immigrants | Grenada | 4.3 /100 | #230 | Tragic 35.0% |
| Immigrants | St. Vincent and the Grenadines | 4.3 /100 | #231 | Tragic 35.0% |
| Hmong | 3.4 /100 | #232 | Tragic 34.8% |