Hmong vs Immigrants from Europe 9th Grade
COMPARE
Hmong
Immigrants from Europe
9th Grade
9th Grade Comparison
Hmong
Immigrants from Europe
95.2%
9TH GRADE
87.7/ 100
METRIC RATING
137th/ 347
METRIC RANK
95.4%
9TH GRADE
95.7/ 100
METRIC RATING
116th/ 347
METRIC RANK
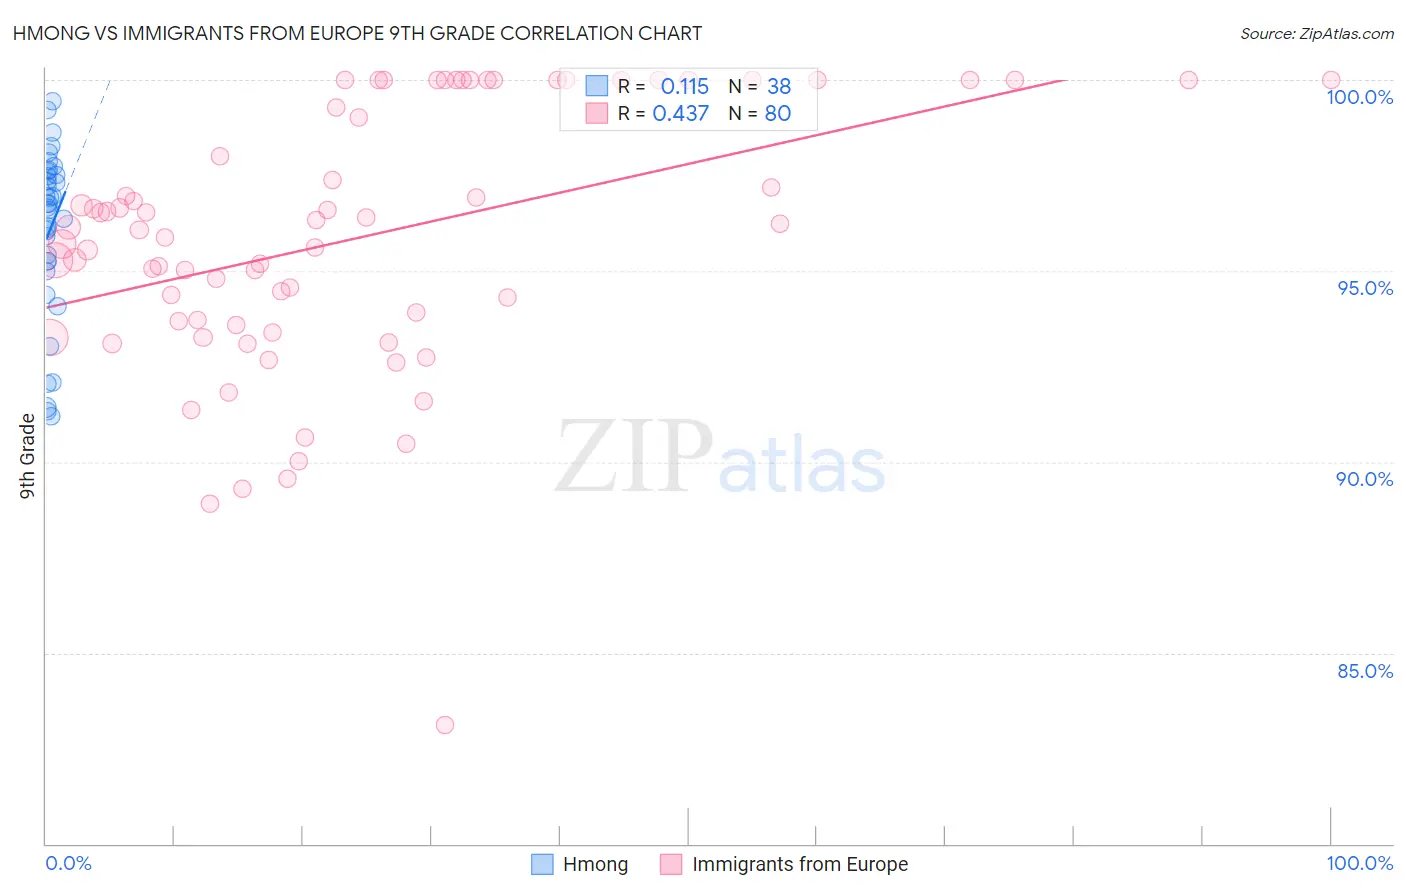
Hmong vs Immigrants from Europe 9th Grade Correlation Chart
The statistical analysis conducted on geographies consisting of 24,672,093 people shows a poor positive correlation between the proportion of Hmong and percentage of population with at least 9th grade education in the United States with a correlation coefficient (R) of 0.115 and weighted average of 95.2%. Similarly, the statistical analysis conducted on geographies consisting of 547,425,973 people shows a moderate positive correlation between the proportion of Immigrants from Europe and percentage of population with at least 9th grade education in the United States with a correlation coefficient (R) of 0.437 and weighted average of 95.4%, a difference of 0.21%.
9th Grade Correlation Summary
| Measurement | Hmong | Immigrants from Europe |
| Minimum | 91.2% | 83.1% |
| Maximum | 99.5% | 100.0% |
| Range | 8.3% | 16.9% |
| Mean | 96.1% | 95.9% |
| Median | 96.7% | 96.1% |
| Interquartile 25% (IQ1) | 95.3% | 93.6% |
| Interquartile 75% (IQ3) | 97.5% | 100.0% |
| Interquartile Range (IQR) | 2.3% | 6.4% |
| Standard Deviation (Sample) | 2.2% | 3.5% |
| Standard Deviation (Population) | 2.2% | 3.4% |
Similar Demographics by 9th Grade
Demographics Similar to Hmong by 9th Grade
In terms of 9th grade, the demographic groups most similar to Hmong are Immigrants from Iran (95.2%, a difference of 0.010%), Immigrants from Belarus (95.2%, a difference of 0.020%), Immigrants from Russia (95.2%, a difference of 0.020%), Immigrants from Eastern Europe (95.2%, a difference of 0.030%), and Immigrants from Israel (95.3%, a difference of 0.040%).
| Demographics | Rating | Rank | 9th Grade |
| Jordanians | 93.5 /100 | #130 | Exceptional 95.3% |
| Immigrants | North Macedonia | 92.3 /100 | #131 | Exceptional 95.3% |
| Immigrants | Nonimmigrants | 92.0 /100 | #132 | Exceptional 95.3% |
| Israelis | 90.4 /100 | #133 | Exceptional 95.3% |
| Immigrants | Israel | 89.6 /100 | #134 | Excellent 95.3% |
| Immigrants | Belarus | 88.9 /100 | #135 | Excellent 95.2% |
| Immigrants | Iran | 88.3 /100 | #136 | Excellent 95.2% |
| Hmong | 87.7 /100 | #137 | Excellent 95.2% |
| Immigrants | Russia | 86.6 /100 | #138 | Excellent 95.2% |
| Immigrants | Eastern Europe | 85.8 /100 | #139 | Excellent 95.2% |
| Immigrants | Taiwan | 85.3 /100 | #140 | Excellent 95.2% |
| Immigrants | Bosnia and Herzegovina | 85.2 /100 | #141 | Excellent 95.2% |
| Immigrants | Greece | 84.6 /100 | #142 | Excellent 95.2% |
| Spanish | 84.4 /100 | #143 | Excellent 95.2% |
| Yup'ik | 83.3 /100 | #144 | Excellent 95.2% |
Demographics Similar to Immigrants from Europe by 9th Grade
In terms of 9th grade, the demographic groups most similar to Immigrants from Europe are Immigrants from Romania (95.4%, a difference of 0.0%), Immigrants from Turkey (95.4%, a difference of 0.0%), Soviet Union (95.4%, a difference of 0.0%), Cambodian (95.4%, a difference of 0.0%), and Burmese (95.4%, a difference of 0.010%).
| Demographics | Rating | Rank | 9th Grade |
| Osage | 96.8 /100 | #109 | Exceptional 95.5% |
| Immigrants | Bulgaria | 96.7 /100 | #110 | Exceptional 95.5% |
| Cherokee | 96.3 /100 | #111 | Exceptional 95.4% |
| Immigrants | Croatia | 96.2 /100 | #112 | Exceptional 95.4% |
| Iroquois | 96.2 /100 | #113 | Exceptional 95.4% |
| German Russians | 96.1 /100 | #114 | Exceptional 95.4% |
| Burmese | 96.0 /100 | #115 | Exceptional 95.4% |
| Immigrants | Europe | 95.7 /100 | #116 | Exceptional 95.4% |
| Immigrants | Romania | 95.6 /100 | #117 | Exceptional 95.4% |
| Immigrants | Turkey | 95.6 /100 | #118 | Exceptional 95.4% |
| Soviet Union | 95.6 /100 | #119 | Exceptional 95.4% |
| Cambodians | 95.6 /100 | #120 | Exceptional 95.4% |
| Cree | 95.5 /100 | #121 | Exceptional 95.4% |
| Immigrants | Kuwait | 95.5 /100 | #122 | Exceptional 95.4% |
| Kiowa | 95.3 /100 | #123 | Exceptional 95.4% |