Hmong vs Immigrants from South America 9th Grade
COMPARE
Hmong
Immigrants from South America
9th Grade
9th Grade Comparison
Hmong
Immigrants from South America
95.2%
9TH GRADE
87.7/ 100
METRIC RATING
137th/ 347
METRIC RANK
93.8%
9TH GRADE
0.2/ 100
METRIC RATING
273rd/ 347
METRIC RANK
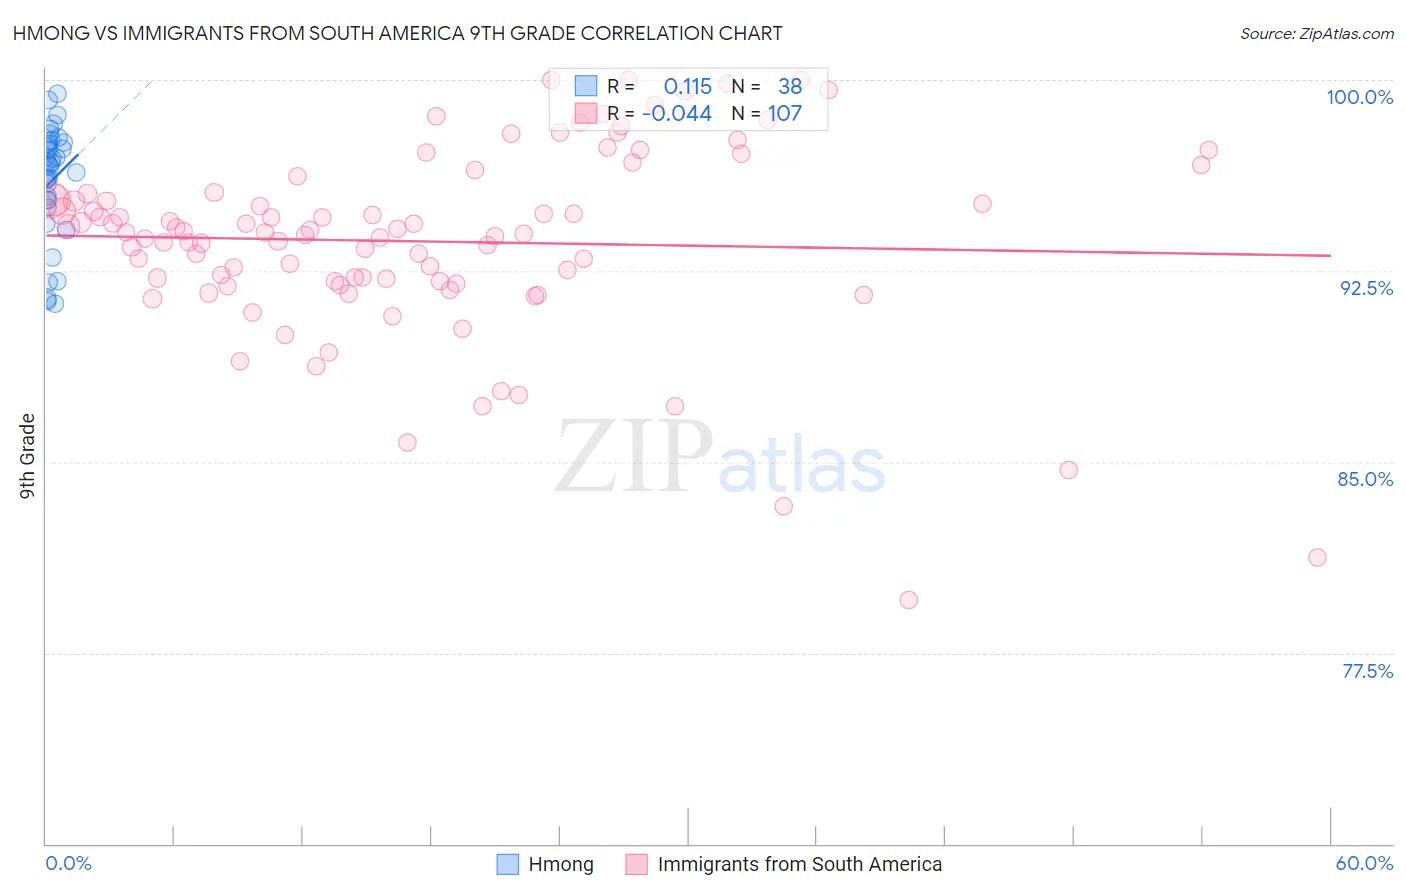
Hmong vs Immigrants from South America 9th Grade Correlation Chart
The statistical analysis conducted on geographies consisting of 24,672,093 people shows a poor positive correlation between the proportion of Hmong and percentage of population with at least 9th grade education in the United States with a correlation coefficient (R) of 0.115 and weighted average of 95.2%. Similarly, the statistical analysis conducted on geographies consisting of 486,312,594 people shows no correlation between the proportion of Immigrants from South America and percentage of population with at least 9th grade education in the United States with a correlation coefficient (R) of -0.044 and weighted average of 93.8%, a difference of 1.5%.
9th Grade Correlation Summary
| Measurement | Hmong | Immigrants from South America |
| Minimum | 91.2% | 79.6% |
| Maximum | 99.5% | 100.0% |
| Range | 8.3% | 20.4% |
| Mean | 96.1% | 93.7% |
| Median | 96.7% | 94.0% |
| Interquartile 25% (IQ1) | 95.3% | 92.1% |
| Interquartile 75% (IQ3) | 97.5% | 95.5% |
| Interquartile Range (IQR) | 2.3% | 3.4% |
| Standard Deviation (Sample) | 2.2% | 3.8% |
| Standard Deviation (Population) | 2.2% | 3.7% |
Similar Demographics by 9th Grade
Demographics Similar to Hmong by 9th Grade
In terms of 9th grade, the demographic groups most similar to Hmong are Immigrants from Iran (95.2%, a difference of 0.010%), Immigrants from Belarus (95.2%, a difference of 0.020%), Immigrants from Russia (95.2%, a difference of 0.020%), Immigrants from Eastern Europe (95.2%, a difference of 0.030%), and Immigrants from Israel (95.3%, a difference of 0.040%).
| Demographics | Rating | Rank | 9th Grade |
| Jordanians | 93.5 /100 | #130 | Exceptional 95.3% |
| Immigrants | North Macedonia | 92.3 /100 | #131 | Exceptional 95.3% |
| Immigrants | Nonimmigrants | 92.0 /100 | #132 | Exceptional 95.3% |
| Israelis | 90.4 /100 | #133 | Exceptional 95.3% |
| Immigrants | Israel | 89.6 /100 | #134 | Excellent 95.3% |
| Immigrants | Belarus | 88.9 /100 | #135 | Excellent 95.2% |
| Immigrants | Iran | 88.3 /100 | #136 | Excellent 95.2% |
| Hmong | 87.7 /100 | #137 | Excellent 95.2% |
| Immigrants | Russia | 86.6 /100 | #138 | Excellent 95.2% |
| Immigrants | Eastern Europe | 85.8 /100 | #139 | Excellent 95.2% |
| Immigrants | Taiwan | 85.3 /100 | #140 | Excellent 95.2% |
| Immigrants | Bosnia and Herzegovina | 85.2 /100 | #141 | Excellent 95.2% |
| Immigrants | Greece | 84.6 /100 | #142 | Excellent 95.2% |
| Spanish | 84.4 /100 | #143 | Excellent 95.2% |
| Yup'ik | 83.3 /100 | #144 | Excellent 95.2% |
Demographics Similar to Immigrants from South America by 9th Grade
In terms of 9th grade, the demographic groups most similar to Immigrants from South America are Peruvian (93.8%, a difference of 0.0%), Immigrants from Western Africa (93.8%, a difference of 0.010%), Immigrants from Colombia (93.8%, a difference of 0.010%), Immigrants from Ghana (93.8%, a difference of 0.020%), and West Indian (93.7%, a difference of 0.030%).
| Demographics | Rating | Rank | 9th Grade |
| Navajo | 0.3 /100 | #266 | Tragic 93.9% |
| Armenians | 0.3 /100 | #267 | Tragic 93.9% |
| Immigrants | Bolivia | 0.3 /100 | #268 | Tragic 93.9% |
| Immigrants | Uruguay | 0.2 /100 | #269 | Tragic 93.8% |
| Yuman | 0.2 /100 | #270 | Tragic 93.8% |
| Immigrants | Ghana | 0.2 /100 | #271 | Tragic 93.8% |
| Immigrants | Western Africa | 0.2 /100 | #272 | Tragic 93.8% |
| Immigrants | South America | 0.2 /100 | #273 | Tragic 93.8% |
| Peruvians | 0.2 /100 | #274 | Tragic 93.8% |
| Immigrants | Colombia | 0.2 /100 | #275 | Tragic 93.8% |
| West Indians | 0.2 /100 | #276 | Tragic 93.7% |
| Immigrants | Philippines | 0.1 /100 | #277 | Tragic 93.7% |
| Immigrants | Eritrea | 0.1 /100 | #278 | Tragic 93.7% |
| Trinidadians and Tobagonians | 0.1 /100 | #279 | Tragic 93.7% |
| Taiwanese | 0.1 /100 | #280 | Tragic 93.6% |