Mexican vs Immigrants from Europe 9th Grade

COMPARE

Mexican
Race
Ancestry
AfghanAfricanAlaska NativeAlaskan AthabascanAlbanianAleutAlsatianAmericanApacheArabArapahoArgentineanArmenianAssyrian/Chaldean/SyriacAustralianAustrianBahamianBangladeshiBarbadianBasqueBelgianBelizeanBermudanBhutaneseBlackfeetBolivianBrazilianBritishBritish West IndianBulgarianBurmeseCajunCambodianCanadianCape VerdeanCarpatho RusynCelticCentral AmericanCentral American IndianCherokeeCheyenneChickasawChileanChineseChippewaChoctawColombianColvilleComancheCosta RicanCreeCreekCroatianCrowCubanCypriotCzechCzechoslovakianDanishDelawareDominicanDutchDutch West IndianEastern EuropeanEcuadorianEgyptianEnglishEstonianEthiopianEuropeanFijianFilipinoFinnishFrenchFrench American IndianFrench CanadianGermanGerman RussianGhanaianGreekGuamanian/ChamorroGuatemalanGuyaneseHaitianHmongHonduranHopiHoumaHungarianIcelanderIndian (Asian)IndonesianInupiatIranianIraqiIrishIroquoisIsraeliItalianJamaicanJapaneseJordanianKenyanKiowaKoreanLaotianLatvianLebaneseLiberianLithuanianLumbeeLuxembourgerMacedonianMalaysianMalteseMarshalleseMenomineeMexicanMexican American IndianMongolianMoroccanNative HawaiianNavajoNepaleseNew ZealanderNicaraguanNigerianNorthern EuropeanNorwegianOkinawanOsageOttawaPaiutePakistaniPalestinianPanamanianParaguayanPennsylvania GermanPeruvianPimaPolishPortuguesePotawatomiPuebloPuerto RicanPuget Sound SalishRomanianRussianSalvadoranSamoanScandinavianScotch-IrishScottishSeminoleSenegaleseSerbianShoshoneSierra LeoneanSiouxSlavicSlovakSloveneSomaliSouth AfricanSouth AmericanSouth American IndianSoviet UnionSpaniardSpanishSpanish AmericanSpanish American IndianSri LankanSubsaharan AfricanSudaneseSwedishSwissSyrianTaiwaneseThaiTlingit-HaidaTohono O'OdhamTonganTrinidadian and TobagonianTsimshianTurkishU.S. Virgin IslanderUgandanUkrainianUruguayanUteVenezuelanVietnameseWelshWest IndianYakamaYaquiYugoslavianYumanYup'ikZimbabwean
Immigration
NonimmigrantsImmigrantsAfghanistanAfricaAlbaniaArgentinaArmeniaAsiaAustraliaAustriaBahamasBangladeshBarbadosBelarusBelgiumBelizeBoliviaBosnia and HerzegovinaBrazilBulgariaBurma/MyanmarCabo VerdeCambodiaCameroonCanadaCaribbeanCentral AmericaChileChinaColombiaCongoCosta RicaCroatiaCubaCzechoslovakiaDenmarkDominicaDominican RepublicEastern AfricaEastern AsiaEastern EuropeEcuadorEgyptEl SalvadorEnglandEritreaEthiopiaFijiFranceGermanyGhanaGreeceGrenadaGuatemalaGuyanaHaitiHondurasHong KongHungaryIndiaIndonesiaIranIraqIrelandIsraelItalyJamaicaJapanJordanKazakhstanKenyaKoreaKuwaitLaosLatin AmericaLatviaLebanonLiberiaLithuaniaMalaysiaMexicoMicronesiaMiddle AfricaMoldovaMoroccoNepalNetherlandsNicaraguaNigeriaNorth AmericaNorth MacedoniaNorthern AfricaNorthern EuropeNorwayOceaniaPakistanPanamaPeruPhilippinesPolandPortugalRomaniaRussiaSaudi ArabiaScotlandSenegalSerbiaSierra LeoneSingaporeSomaliaSouth AfricaSouth AmericaSouth Central AsiaSouth Eastern AsiaSouthern EuropeSpainSri LankaSt. Vincent and the GrenadinesSudanSwedenSwitzerlandSyriaTaiwanThailandTrinidad and TobagoTurkeyUgandaUkraineUruguayUzbekistanVenezuelaVietnamWest IndiesWestern AfricaWestern AsiaWestern EuropeYemenZaireZimbabweAzores
Immigrants from Europe
Race
Ancestry
AfghanAfricanAlaska NativeAlaskan AthabascanAlbanianAleutAlsatianAmericanApacheArabArapahoArgentineanArmenianAssyrian/Chaldean/SyriacAustralianAustrianBahamianBangladeshiBarbadianBasqueBelgianBelizeanBermudanBhutaneseBlackfeetBolivianBrazilianBritishBritish West IndianBulgarianBurmeseCajunCambodianCanadianCape VerdeanCarpatho RusynCelticCentral AmericanCentral American IndianCherokeeCheyenneChickasawChileanChineseChippewaChoctawColombianColvilleComancheCosta RicanCreeCreekCroatianCrowCubanCypriotCzechCzechoslovakianDanishDelawareDominicanDutchDutch West IndianEastern EuropeanEcuadorianEgyptianEnglishEstonianEthiopianEuropeanFijianFilipinoFinnishFrenchFrench American IndianFrench CanadianGermanGerman RussianGhanaianGreekGuamanian/ChamorroGuatemalanGuyaneseHaitianHmongHonduranHopiHoumaHungarianIcelanderIndian (Asian)IndonesianInupiatIranianIraqiIrishIroquoisIsraeliItalianJamaicanJapaneseJordanianKenyanKiowaKoreanLaotianLatvianLebaneseLiberianLithuanianLumbeeLuxembourgerMacedonianMalaysianMalteseMarshalleseMenomineeMexican American IndianMongolianMoroccanNative HawaiianNavajoNepaleseNew ZealanderNicaraguanNigerianNorthern EuropeanNorwegianOkinawanOsageOttawaPaiutePakistaniPalestinianPanamanianParaguayanPennsylvania GermanPeruvianPimaPolishPortuguesePotawatomiPuebloPuerto RicanPuget Sound SalishRomanianRussianSalvadoranSamoanScandinavianScotch-IrishScottishSeminoleSenegaleseSerbianShoshoneSierra LeoneanSiouxSlavicSlovakSloveneSomaliSouth AfricanSouth AmericanSouth American IndianSoviet UnionSpaniardSpanishSpanish AmericanSpanish American IndianSri LankanSubsaharan AfricanSudaneseSwedishSwissSyrianTaiwaneseThaiTlingit-HaidaTohono O'OdhamTonganTrinidadian and TobagonianTsimshianTurkishU.S. Virgin IslanderUgandanUkrainianUruguayanUteVenezuelanVietnameseWelshWest IndianYakamaYaquiYugoslavianYumanYup'ikZimbabwean
Immigration
NonimmigrantsImmigrantsAfghanistanAfricaAlbaniaArgentinaArmeniaAsiaAustraliaAustriaBahamasBangladeshBarbadosBelarusBelgiumBelizeBoliviaBosnia and HerzegovinaBrazilBulgariaBurma/MyanmarCabo VerdeCambodiaCameroonCanadaCaribbeanCentral AmericaChileChinaColombiaCongoCosta RicaCroatiaCubaCzechoslovakiaDenmarkDominicaDominican RepublicEastern AfricaEastern AsiaEastern EuropeEcuadorEgyptEl SalvadorEnglandEritreaEthiopiaEuropeFijiFranceGermanyGhanaGreeceGrenadaGuatemalaGuyanaHaitiHondurasHong KongHungaryIndiaIndonesiaIranIraqIrelandIsraelItalyJamaicaJapanJordanKazakhstanKenyaKoreaKuwaitLaosLatin AmericaLatviaLebanonLiberiaLithuaniaMalaysiaMexicoMicronesiaMiddle AfricaMoldovaMoroccoNepalNetherlandsNicaraguaNigeriaNorth AmericaNorth MacedoniaNorthern AfricaNorthern EuropeNorwayOceaniaPakistanPanamaPeruPhilippinesPolandPortugalRomaniaRussiaSaudi ArabiaScotlandSenegalSerbiaSierra LeoneSingaporeSomaliaSouth AfricaSouth AmericaSouth Central AsiaSouth Eastern AsiaSouthern EuropeSpainSri LankaSt. Vincent and the GrenadinesSudanSwedenSwitzerlandSyriaTaiwanThailandTrinidad and TobagoTurkeyUgandaUkraineUruguayUzbekistanVenezuelaVietnamWest IndiesWestern AfricaWestern AsiaWestern EuropeYemenZaireZimbabweAzores
9th Grade
Income
Poverty
Unemployment
Labor Participation
Family Structure
Vehicle Availability
Education Level
Disability

9th Grade Comparison

Mexicans

Immigrants from Europe

Tragic
Exceptional
90.0%
9TH GRADE
0.0/ 100
METRIC RATING
340th/ 347
METRIC RANK
95.4%
9TH GRADE
95.7/ 100
METRIC RATING
116th/ 347
METRIC RANK

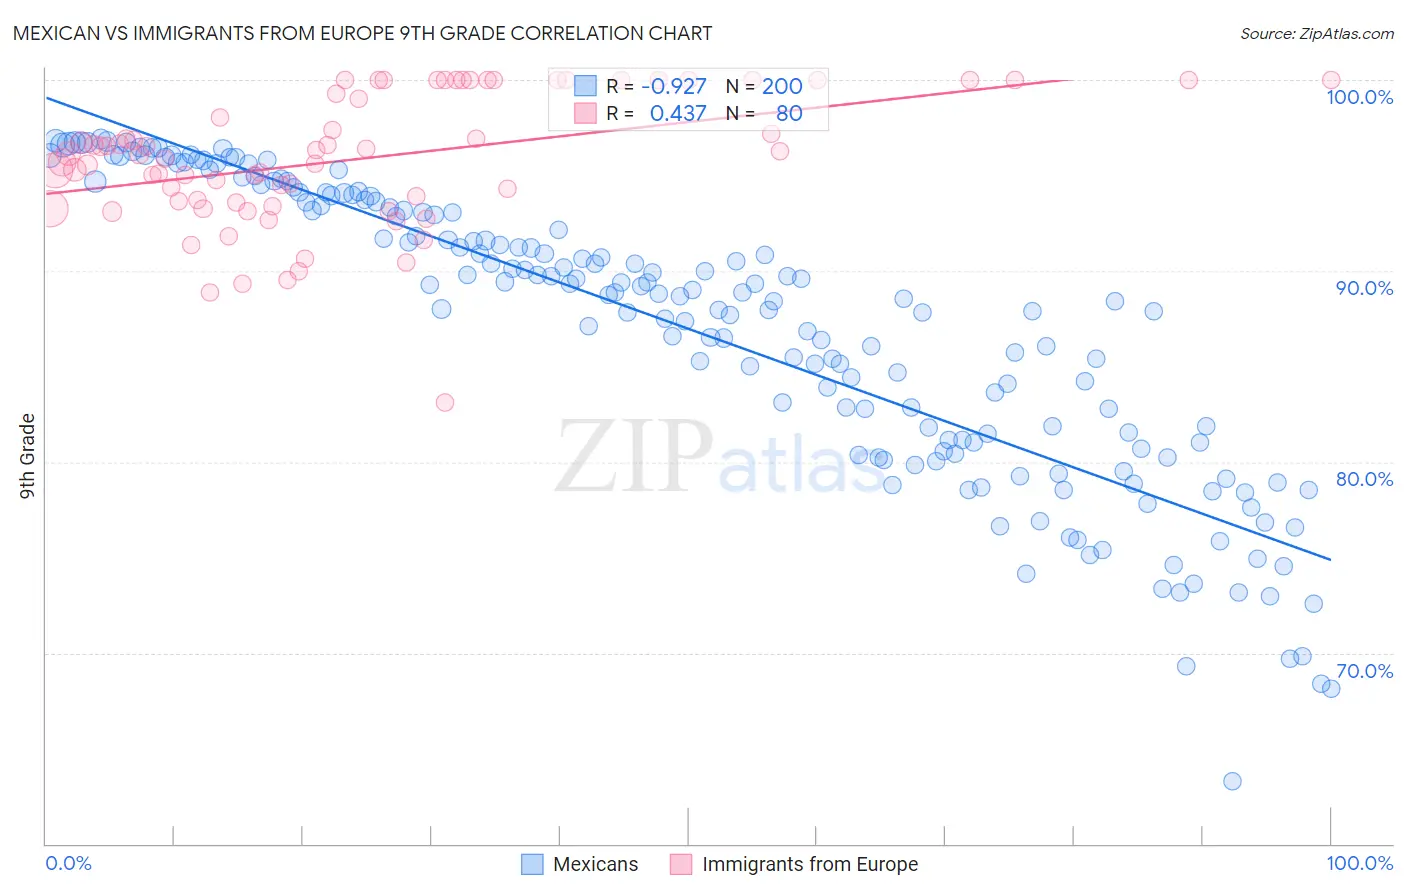
Mexican vs Immigrants from Europe 9th Grade Correlation Chart

The statistical analysis conducted on geographies consisting of 565,339,264 people shows a near-perfect negative correlation between the proportion of Mexicans and percentage of population with at least 9th grade education in the United States with a correlation coefficient (R) of -0.927 and weighted average of 90.0%. Similarly, the statistical analysis conducted on geographies consisting of 547,425,973 people shows a moderate positive correlation between the proportion of Immigrants from Europe and percentage of population with at least 9th grade education in the United States with a correlation coefficient (R) of 0.437 and weighted average of 95.4%, a difference of 6.0%.
Mexican vs Immigrants from Europe 9th Grade

9th Grade Correlation Summary

MeasurementMexicanImmigrants from Europe
Minimum63.2%83.1%
Maximum96.9%100.0%
Range33.7%16.9%
Mean87.0%95.9%
Median88.8%96.1%
Interquartile 25% (IQ1)81.0%93.6%
Interquartile 75% (IQ3)93.5%100.0%
Interquartile Range (IQR)12.5%6.4%
Standard Deviation (Sample)7.6%3.5%
Standard Deviation (Population)7.5%3.4%

Similar Demographics by 9th Grade

Demographics Similar to Mexicans by 9th Grade

In terms of 9th grade, the demographic groups most similar to Mexicans are Yakama (90.1%, a difference of 0.060%), Guatemalan (89.9%, a difference of 0.13%), Central American (90.4%, a difference of 0.40%), Immigrants from Latin America (90.4%, a difference of 0.41%), and Salvadoran (89.6%, a difference of 0.43%).
DemographicsRating | Rank9th Grade
Immigrants | Yemen
0.0
/100
|
#333
Tragic
90.8%
Immigrants | Azores
0.0
/100
|
#334
Tragic
90.8%
Immigrants | Honduras
0.0
/100
|
#335
Tragic
90.6%
Immigrants | Dominican Republic
0.0
/100
|
#336
Tragic
90.5%
Immigrants | Latin America
0.0
/100
|
#337
Tragic
90.4%
Central Americans
0.0
/100
|
#338
Tragic
90.4%
Yakama
0.0
/100
|
#339
Tragic
90.1%
Mexicans
0.0
/100
|
#340
Tragic
90.0%
Guatemalans
0.0
/100
|
#341
Tragic
89.9%
Salvadorans
0.0
/100
|
#342
Tragic
89.6%
Immigrants | Guatemala
0.0
/100
|
#343
Tragic
89.4%
Immigrants | El Salvador
0.0
/100
|
#344
Tragic
89.0%
Immigrants | Central America
0.0
/100
|
#345
Tragic
89.0%
Immigrants | Mexico
0.0
/100
|
#346
Tragic
88.7%
Spanish American Indians
0.0
/100
|
#347
Tragic
88.3%

Demographics Similar to Immigrants from Europe by 9th Grade

In terms of 9th grade, the demographic groups most similar to Immigrants from Europe are Immigrants from Romania (95.4%, a difference of 0.0%), Immigrants from Turkey (95.4%, a difference of 0.0%), Soviet Union (95.4%, a difference of 0.0%), Cambodian (95.4%, a difference of 0.0%), and Burmese (95.4%, a difference of 0.010%).
DemographicsRating | Rank9th Grade
Osage
96.8
/100
|
#109
Exceptional
95.5%
Immigrants | Bulgaria
96.7
/100
|
#110
Exceptional
95.5%
Cherokee
96.3
/100
|
#111
Exceptional
95.4%
Immigrants | Croatia
96.2
/100
|
#112
Exceptional
95.4%
Iroquois
96.2
/100
|
#113
Exceptional
95.4%
German Russians
96.1
/100
|
#114
Exceptional
95.4%
Burmese
96.0
/100
|
#115
Exceptional
95.4%
Immigrants | Europe
95.7
/100
|
#116
Exceptional
95.4%
Immigrants | Romania
95.6
/100
|
#117
Exceptional
95.4%
Immigrants | Turkey
95.6
/100
|
#118
Exceptional
95.4%
Soviet Union
95.6
/100
|
#119
Exceptional
95.4%
Cambodians
95.6
/100
|
#120
Exceptional
95.4%
Cree
95.5
/100
|
#121
Exceptional
95.4%
Immigrants | Kuwait
95.5
/100
|
#122
Exceptional
95.4%
Kiowa
95.3
/100
|
#123
Exceptional
95.4%