Immigrants from Israel vs Immigrants from Europe 9th Grade
COMPARE
Immigrants from Israel
Immigrants from Europe
9th Grade
9th Grade Comparison
Immigrants from Israel
Immigrants from Europe
95.3%
9TH GRADE
89.6/ 100
METRIC RATING
134th/ 347
METRIC RANK
95.4%
9TH GRADE
95.7/ 100
METRIC RATING
116th/ 347
METRIC RANK
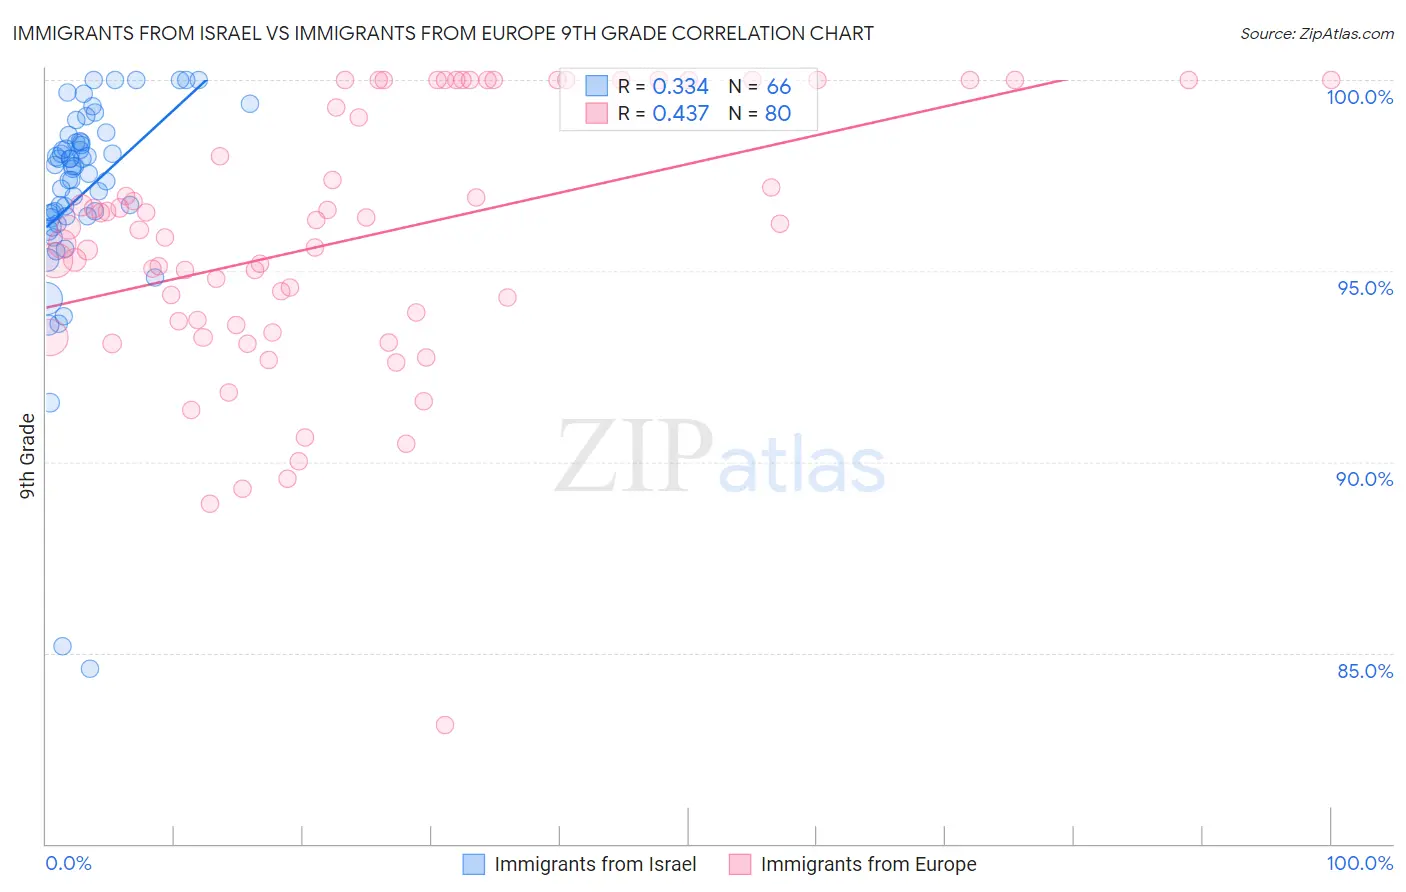
Immigrants from Israel vs Immigrants from Europe 9th Grade Correlation Chart
The statistical analysis conducted on geographies consisting of 210,030,386 people shows a mild positive correlation between the proportion of Immigrants from Israel and percentage of population with at least 9th grade education in the United States with a correlation coefficient (R) of 0.334 and weighted average of 95.3%. Similarly, the statistical analysis conducted on geographies consisting of 547,425,973 people shows a moderate positive correlation between the proportion of Immigrants from Europe and percentage of population with at least 9th grade education in the United States with a correlation coefficient (R) of 0.437 and weighted average of 95.4%, a difference of 0.17%.
9th Grade Correlation Summary
| Measurement | Immigrants from Israel | Immigrants from Europe |
| Minimum | 84.6% | 83.1% |
| Maximum | 100.0% | 100.0% |
| Range | 15.4% | 16.9% |
| Mean | 97.0% | 95.9% |
| Median | 97.7% | 96.1% |
| Interquartile 25% (IQ1) | 96.4% | 93.6% |
| Interquartile 75% (IQ3) | 98.4% | 100.0% |
| Interquartile Range (IQR) | 2.0% | 6.4% |
| Standard Deviation (Sample) | 2.8% | 3.5% |
| Standard Deviation (Population) | 2.8% | 3.4% |
Demographics Similar to Immigrants from Israel and Immigrants from Europe by 9th Grade
In terms of 9th grade, the demographic groups most similar to Immigrants from Israel are Immigrants from Belarus (95.2%, a difference of 0.010%), Israeli (95.3%, a difference of 0.020%), Nonimmigrants (95.3%, a difference of 0.050%), Immigrants from North Macedonia (95.3%, a difference of 0.060%), and Jordanian (95.3%, a difference of 0.090%). Similarly, the demographic groups most similar to Immigrants from Europe are Immigrants from Romania (95.4%, a difference of 0.0%), Immigrants from Turkey (95.4%, a difference of 0.0%), Soviet Union (95.4%, a difference of 0.0%), Cambodian (95.4%, a difference of 0.0%), and Burmese (95.4%, a difference of 0.010%).
| Demographics | Rating | Rank | 9th Grade |
| Burmese | 96.0 /100 | #115 | Exceptional 95.4% |
| Immigrants | Europe | 95.7 /100 | #116 | Exceptional 95.4% |
| Immigrants | Romania | 95.6 /100 | #117 | Exceptional 95.4% |
| Immigrants | Turkey | 95.6 /100 | #118 | Exceptional 95.4% |
| Soviet Union | 95.6 /100 | #119 | Exceptional 95.4% |
| Cambodians | 95.6 /100 | #120 | Exceptional 95.4% |
| Cree | 95.5 /100 | #121 | Exceptional 95.4% |
| Immigrants | Kuwait | 95.5 /100 | #122 | Exceptional 95.4% |
| Kiowa | 95.3 /100 | #123 | Exceptional 95.4% |
| Shoshone | 95.3 /100 | #124 | Exceptional 95.4% |
| Immigrants | South Central Asia | 95.1 /100 | #125 | Exceptional 95.4% |
| Immigrants | Serbia | 94.4 /100 | #126 | Exceptional 95.4% |
| Palestinians | 94.3 /100 | #127 | Exceptional 95.4% |
| Immigrants | Hungary | 94.2 /100 | #128 | Exceptional 95.4% |
| Basques | 94.1 /100 | #129 | Exceptional 95.4% |
| Jordanians | 93.5 /100 | #130 | Exceptional 95.3% |
| Immigrants | North Macedonia | 92.3 /100 | #131 | Exceptional 95.3% |
| Immigrants | Nonimmigrants | 92.0 /100 | #132 | Exceptional 95.3% |
| Israelis | 90.4 /100 | #133 | Exceptional 95.3% |
| Immigrants | Israel | 89.6 /100 | #134 | Excellent 95.3% |
| Immigrants | Belarus | 88.9 /100 | #135 | Excellent 95.2% |