Hmong vs Immigrants from Uruguay 9th Grade
COMPARE
Hmong
Immigrants from Uruguay
9th Grade
9th Grade Comparison
Hmong
Immigrants from Uruguay
95.2%
9TH GRADE
87.7/ 100
METRIC RATING
137th/ 347
METRIC RANK
93.8%
9TH GRADE
0.2/ 100
METRIC RATING
269th/ 347
METRIC RANK
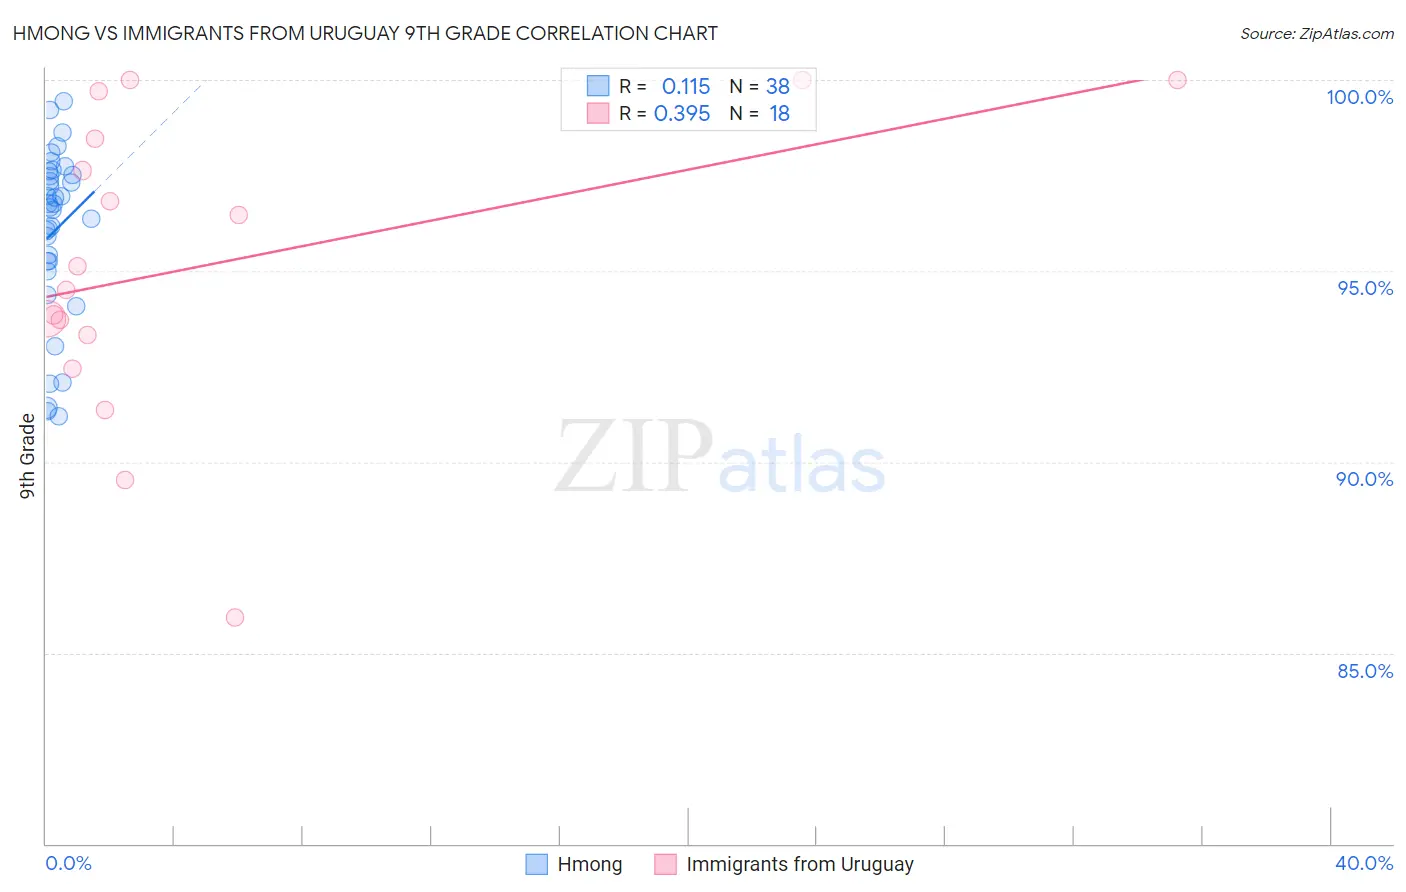
Hmong vs Immigrants from Uruguay 9th Grade Correlation Chart
The statistical analysis conducted on geographies consisting of 24,672,093 people shows a poor positive correlation between the proportion of Hmong and percentage of population with at least 9th grade education in the United States with a correlation coefficient (R) of 0.115 and weighted average of 95.2%. Similarly, the statistical analysis conducted on geographies consisting of 133,259,667 people shows a mild positive correlation between the proportion of Immigrants from Uruguay and percentage of population with at least 9th grade education in the United States with a correlation coefficient (R) of 0.395 and weighted average of 93.8%, a difference of 1.5%.
9th Grade Correlation Summary
| Measurement | Hmong | Immigrants from Uruguay |
| Minimum | 91.2% | 85.9% |
| Maximum | 99.5% | 100.0% |
| Range | 8.3% | 14.1% |
| Mean | 96.1% | 95.1% |
| Median | 96.7% | 94.8% |
| Interquartile 25% (IQ1) | 95.3% | 93.3% |
| Interquartile 75% (IQ3) | 97.5% | 98.5% |
| Interquartile Range (IQR) | 2.3% | 5.2% |
| Standard Deviation (Sample) | 2.2% | 3.9% |
| Standard Deviation (Population) | 2.2% | 3.8% |
Similar Demographics by 9th Grade
Demographics Similar to Hmong by 9th Grade
In terms of 9th grade, the demographic groups most similar to Hmong are Immigrants from Iran (95.2%, a difference of 0.010%), Immigrants from Belarus (95.2%, a difference of 0.020%), Immigrants from Russia (95.2%, a difference of 0.020%), Immigrants from Eastern Europe (95.2%, a difference of 0.030%), and Immigrants from Israel (95.3%, a difference of 0.040%).
| Demographics | Rating | Rank | 9th Grade |
| Jordanians | 93.5 /100 | #130 | Exceptional 95.3% |
| Immigrants | North Macedonia | 92.3 /100 | #131 | Exceptional 95.3% |
| Immigrants | Nonimmigrants | 92.0 /100 | #132 | Exceptional 95.3% |
| Israelis | 90.4 /100 | #133 | Exceptional 95.3% |
| Immigrants | Israel | 89.6 /100 | #134 | Excellent 95.3% |
| Immigrants | Belarus | 88.9 /100 | #135 | Excellent 95.2% |
| Immigrants | Iran | 88.3 /100 | #136 | Excellent 95.2% |
| Hmong | 87.7 /100 | #137 | Excellent 95.2% |
| Immigrants | Russia | 86.6 /100 | #138 | Excellent 95.2% |
| Immigrants | Eastern Europe | 85.8 /100 | #139 | Excellent 95.2% |
| Immigrants | Taiwan | 85.3 /100 | #140 | Excellent 95.2% |
| Immigrants | Bosnia and Herzegovina | 85.2 /100 | #141 | Excellent 95.2% |
| Immigrants | Greece | 84.6 /100 | #142 | Excellent 95.2% |
| Spanish | 84.4 /100 | #143 | Excellent 95.2% |
| Yup'ik | 83.3 /100 | #144 | Excellent 95.2% |
Demographics Similar to Immigrants from Uruguay by 9th Grade
In terms of 9th grade, the demographic groups most similar to Immigrants from Uruguay are Yuman (93.8%, a difference of 0.010%), Immigrants from Ghana (93.8%, a difference of 0.030%), Immigrants from Bolivia (93.9%, a difference of 0.040%), Immigrants from Western Africa (93.8%, a difference of 0.040%), and Immigrants from South America (93.8%, a difference of 0.050%).
| Demographics | Rating | Rank | 9th Grade |
| Immigrants | Jamaica | 0.4 /100 | #262 | Tragic 93.9% |
| Immigrants | Uzbekistan | 0.4 /100 | #263 | Tragic 93.9% |
| Immigrants | Congo | 0.4 /100 | #264 | Tragic 93.9% |
| Natives/Alaskans | 0.4 /100 | #265 | Tragic 93.9% |
| Navajo | 0.3 /100 | #266 | Tragic 93.9% |
| Armenians | 0.3 /100 | #267 | Tragic 93.9% |
| Immigrants | Bolivia | 0.3 /100 | #268 | Tragic 93.9% |
| Immigrants | Uruguay | 0.2 /100 | #269 | Tragic 93.8% |
| Yuman | 0.2 /100 | #270 | Tragic 93.8% |
| Immigrants | Ghana | 0.2 /100 | #271 | Tragic 93.8% |
| Immigrants | Western Africa | 0.2 /100 | #272 | Tragic 93.8% |
| Immigrants | South America | 0.2 /100 | #273 | Tragic 93.8% |
| Peruvians | 0.2 /100 | #274 | Tragic 93.8% |
| Immigrants | Colombia | 0.2 /100 | #275 | Tragic 93.8% |
| West Indians | 0.2 /100 | #276 | Tragic 93.7% |