Japanese vs Burmese No Schooling Completed
COMPARE
Japanese
Burmese
No Schooling Completed
No Schooling Completed Comparison
Japanese
Burmese
3.3%
NO SCHOOLING COMPLETED
0.0/ 100
METRIC RATING
331st/ 347
METRIC RANK
1.9%
NO SCHOOLING COMPLETED
88.2/ 100
METRIC RATING
136th/ 347
METRIC RANK
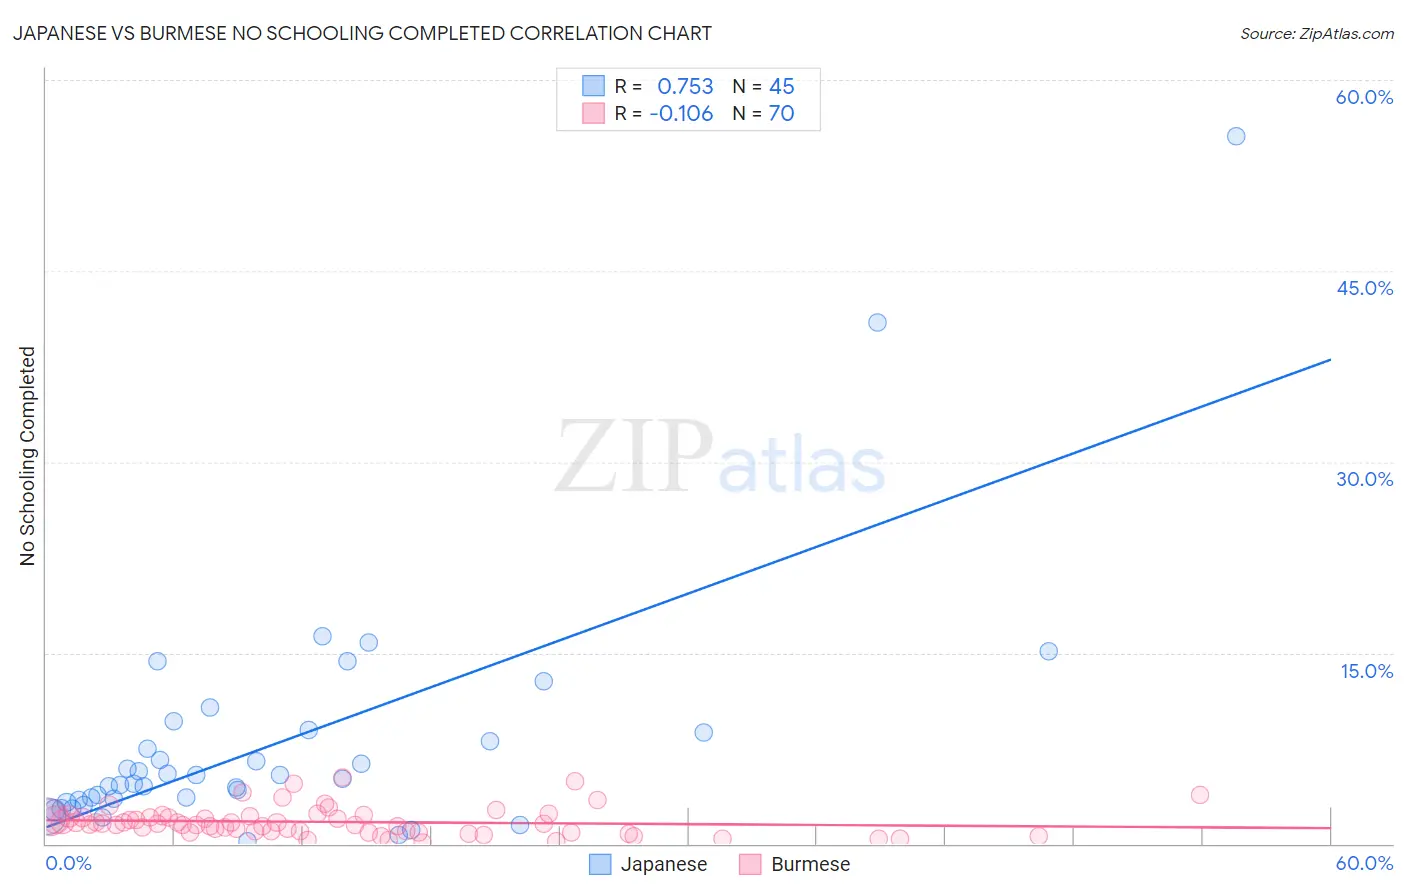
Japanese vs Burmese No Schooling Completed Correlation Chart
The statistical analysis conducted on geographies consisting of 248,181,400 people shows a strong positive correlation between the proportion of Japanese and percentage of population with no schooling in the United States with a correlation coefficient (R) of 0.753 and weighted average of 3.3%. Similarly, the statistical analysis conducted on geographies consisting of 458,309,119 people shows a poor negative correlation between the proportion of Burmese and percentage of population with no schooling in the United States with a correlation coefficient (R) of -0.106 and weighted average of 1.9%, a difference of 71.7%.
No Schooling Completed Correlation Summary
| Measurement | Japanese | Burmese |
| Minimum | 0.20% | 0.081% |
| Maximum | 55.6% | 5.2% |
| Range | 55.4% | 5.1% |
| Mean | 8.0% | 1.7% |
| Median | 5.1% | 1.5% |
| Interquartile 25% (IQ1) | 3.3% | 0.98% |
| Interquartile 75% (IQ3) | 8.8% | 2.1% |
| Interquartile Range (IQR) | 5.5% | 1.1% |
| Standard Deviation (Sample) | 9.8% | 1.1% |
| Standard Deviation (Population) | 9.7% | 1.1% |
Similar Demographics by No Schooling Completed
Demographics Similar to Japanese by No Schooling Completed
In terms of no schooling completed, the demographic groups most similar to Japanese are Immigrants from Armenia (3.3%, a difference of 0.030%), Immigrants from Vietnam (3.3%, a difference of 0.45%), Central American (3.4%, a difference of 1.5%), Mexican (3.3%, a difference of 1.5%), and Immigrants from Dominican Republic (3.4%, a difference of 1.6%).
| Demographics | Rating | Rank | No Schooling Completed |
| Mexican American Indians | 0.0 /100 | #324 | Tragic 3.2% |
| Dominicans | 0.0 /100 | #325 | Tragic 3.2% |
| Indonesians | 0.0 /100 | #326 | Tragic 3.2% |
| Immigrants | Latin America | 0.0 /100 | #327 | Tragic 3.3% |
| Mexicans | 0.0 /100 | #328 | Tragic 3.3% |
| Immigrants | Vietnam | 0.0 /100 | #329 | Tragic 3.3% |
| Immigrants | Armenia | 0.0 /100 | #330 | Tragic 3.3% |
| Japanese | 0.0 /100 | #331 | Tragic 3.3% |
| Central Americans | 0.0 /100 | #332 | Tragic 3.4% |
| Immigrants | Dominican Republic | 0.0 /100 | #333 | Tragic 3.4% |
| Guatemalans | 0.0 /100 | #334 | Tragic 3.5% |
| Immigrants | Cambodia | 0.0 /100 | #335 | Tragic 3.5% |
| Immigrants | Fiji | 0.0 /100 | #336 | Tragic 3.5% |
| Immigrants | Cabo Verde | 0.0 /100 | #337 | Tragic 3.5% |
| Bangladeshis | 0.0 /100 | #338 | Tragic 3.5% |
Demographics Similar to Burmese by No Schooling Completed
In terms of no schooling completed, the demographic groups most similar to Burmese are Hmong (1.9%, a difference of 0.090%), Menominee (1.9%, a difference of 0.49%), Immigrants from Turkey (1.9%, a difference of 0.74%), Colville (1.9%, a difference of 0.84%), and Filipino (2.0%, a difference of 0.86%).
| Demographics | Rating | Rank | No Schooling Completed |
| Seminole | 92.0 /100 | #129 | Exceptional 1.9% |
| Palestinians | 91.8 /100 | #130 | Exceptional 1.9% |
| Immigrants | Hungary | 91.6 /100 | #131 | Exceptional 1.9% |
| Colville | 90.4 /100 | #132 | Exceptional 1.9% |
| Immigrants | Turkey | 90.2 /100 | #133 | Exceptional 1.9% |
| Menominee | 89.6 /100 | #134 | Excellent 1.9% |
| Hmong | 88.5 /100 | #135 | Excellent 1.9% |
| Burmese | 88.2 /100 | #136 | Excellent 1.9% |
| Filipinos | 85.5 /100 | #137 | Excellent 2.0% |
| Immigrants | Israel | 85.4 /100 | #138 | Excellent 2.0% |
| Jordanians | 84.5 /100 | #139 | Excellent 2.0% |
| Marshallese | 83.5 /100 | #140 | Excellent 2.0% |
| Immigrants | Greece | 83.5 /100 | #141 | Excellent 2.0% |
| Venezuelans | 81.5 /100 | #142 | Excellent 2.0% |
| Immigrants | South Central Asia | 80.0 /100 | #143 | Good 2.0% |