Slovene vs Burmese No Schooling Completed

COMPARE

Slovene
Race
Ancestry
AfghanAfricanAlaska NativeAlaskan AthabascanAlbanianAleutAlsatianAmericanApacheArabArapahoArgentineanArmenianAssyrian/Chaldean/SyriacAustralianAustrianBahamianBangladeshiBarbadianBasqueBelgianBelizeanBermudanBhutaneseBlackfeetBolivianBrazilianBritishBritish West IndianBulgarianCajunCambodianCanadianCape VerdeanCarpatho RusynCelticCentral AmericanCentral American IndianCherokeeCheyenneChickasawChileanChineseChippewaChoctawColombianColvilleComancheCosta RicanCreeCreekCroatianCrowCubanCypriotCzechCzechoslovakianDanishDelawareDominicanDutchDutch West IndianEastern EuropeanEcuadorianEgyptianEnglishEstonianEthiopianEuropeanFijianFilipinoFinnishFrenchFrench American IndianFrench CanadianGermanGerman RussianGhanaianGreekGuamanian/ChamorroGuatemalanGuyaneseHaitianHmongHonduranHopiHoumaHungarianIcelanderIndian (Asian)IndonesianInupiatIranianIraqiIrishIroquoisIsraeliItalianJamaicanJapaneseJordanianKenyanKiowaKoreanLaotianLatvianLebaneseLiberianLithuanianLumbeeLuxembourgerMacedonianMalaysianMalteseMarshalleseMenomineeMexicanMexican American IndianMongolianMoroccanNative HawaiianNavajoNepaleseNew ZealanderNicaraguanNigerianNorthern EuropeanNorwegianOkinawanOsageOttawaPaiutePakistaniPalestinianPanamanianParaguayanPennsylvania GermanPeruvianPimaPolishPortuguesePotawatomiPuebloPuerto RicanPuget Sound SalishRomanianRussianSalvadoranSamoanScandinavianScotch-IrishScottishSeminoleSenegaleseSerbianShoshoneSierra LeoneanSiouxSlavicSlovakSloveneSomaliSouth AfricanSouth AmericanSouth American IndianSoviet UnionSpaniardSpanishSpanish AmericanSpanish American IndianSri LankanSubsaharan AfricanSudaneseSwedishSwissSyrianTaiwaneseThaiTlingit-HaidaTohono O'OdhamTonganTrinidadian and TobagonianTsimshianTurkishU.S. Virgin IslanderUgandanUkrainianUruguayanUteVenezuelanVietnameseWelshWest IndianYakamaYaquiYugoslavianYumanYup'ikZimbabwean
Immigration
NonimmigrantsImmigrantsAfghanistanAfricaAlbaniaArgentinaArmeniaAsiaAustraliaAustriaBahamasBangladeshBarbadosBelarusBelgiumBelizeBoliviaBosnia and HerzegovinaBrazilBulgariaBurma/MyanmarCabo VerdeCambodiaCameroonCanadaCaribbeanCentral AmericaChileChinaColombiaCongoCosta RicaCroatiaCubaCzechoslovakiaDenmarkDominicaDominican RepublicEastern AfricaEastern AsiaEastern EuropeEcuadorEgyptEl SalvadorEnglandEritreaEthiopiaEuropeFijiFranceGermanyGhanaGreeceGrenadaGuatemalaGuyanaHaitiHondurasHong KongHungaryIndiaIndonesiaIranIraqIrelandIsraelItalyJamaicaJapanJordanKazakhstanKenyaKoreaKuwaitLaosLatin AmericaLatviaLebanonLiberiaLithuaniaMalaysiaMexicoMicronesiaMiddle AfricaMoldovaMoroccoNepalNetherlandsNicaraguaNigeriaNorth AmericaNorth MacedoniaNorthern AfricaNorthern EuropeNorwayOceaniaPakistanPanamaPeruPhilippinesPolandPortugalRomaniaRussiaSaudi ArabiaScotlandSenegalSerbiaSierra LeoneSingaporeSomaliaSouth AfricaSouth AmericaSouth Central AsiaSouth Eastern AsiaSouthern EuropeSpainSri LankaSt. Vincent and the GrenadinesSudanSwedenSwitzerlandSyriaTaiwanThailandTrinidad and TobagoTurkeyUgandaUkraineUruguayUzbekistanVenezuelaVietnamWest IndiesWestern AfricaWestern AsiaWestern EuropeYemenZaireZimbabweAzores
Burmese
Race
Ancestry
AfghanAfricanAlaska NativeAlaskan AthabascanAlbanianAleutAlsatianAmericanApacheArabArapahoArgentineanArmenianAssyrian/Chaldean/SyriacAustralianAustrianBahamianBangladeshiBarbadianBasqueBelgianBelizeanBermudanBhutaneseBlackfeetBolivianBrazilianBritishBritish West IndianBulgarianBurmeseCajunCambodianCanadianCape VerdeanCarpatho RusynCelticCentral AmericanCentral American IndianCherokeeCheyenneChickasawChileanChineseChippewaChoctawColombianColvilleComancheCosta RicanCreeCreekCroatianCrowCubanCypriotCzechCzechoslovakianDanishDelawareDominicanDutchDutch West IndianEastern EuropeanEcuadorianEgyptianEnglishEstonianEthiopianEuropeanFijianFilipinoFinnishFrenchFrench American IndianFrench CanadianGermanGerman RussianGhanaianGreekGuamanian/ChamorroGuatemalanGuyaneseHaitianHmongHonduranHopiHoumaHungarianIcelanderIndian (Asian)IndonesianInupiatIranianIraqiIrishIroquoisIsraeliItalianJamaicanJapaneseJordanianKenyanKiowaKoreanLaotianLatvianLebaneseLiberianLithuanianLumbeeLuxembourgerMacedonianMalaysianMalteseMarshalleseMenomineeMexicanMexican American IndianMongolianMoroccanNative HawaiianNavajoNepaleseNew ZealanderNicaraguanNigerianNorthern EuropeanNorwegianOkinawanOsageOttawaPaiutePakistaniPalestinianPanamanianParaguayanPennsylvania GermanPeruvianPimaPolishPortuguesePotawatomiPuebloPuerto RicanPuget Sound SalishRomanianRussianSalvadoranSamoanScandinavianScotch-IrishScottishSeminoleSenegaleseSerbianShoshoneSierra LeoneanSiouxSlavicSlovakSomaliSouth AfricanSouth AmericanSouth American IndianSoviet UnionSpaniardSpanishSpanish AmericanSpanish American IndianSri LankanSubsaharan AfricanSudaneseSwedishSwissSyrianTaiwaneseThaiTlingit-HaidaTohono O'OdhamTonganTrinidadian and TobagonianTsimshianTurkishU.S. Virgin IslanderUgandanUkrainianUruguayanUteVenezuelanVietnameseWelshWest IndianYakamaYaquiYugoslavianYumanYup'ikZimbabwean
Immigration
NonimmigrantsImmigrantsAfghanistanAfricaAlbaniaArgentinaArmeniaAsiaAustraliaAustriaBahamasBangladeshBarbadosBelarusBelgiumBelizeBoliviaBosnia and HerzegovinaBrazilBulgariaBurma/MyanmarCabo VerdeCambodiaCameroonCanadaCaribbeanCentral AmericaChileChinaColombiaCongoCosta RicaCroatiaCubaCzechoslovakiaDenmarkDominicaDominican RepublicEastern AfricaEastern AsiaEastern EuropeEcuadorEgyptEl SalvadorEnglandEritreaEthiopiaEuropeFijiFranceGermanyGhanaGreeceGrenadaGuatemalaGuyanaHaitiHondurasHong KongHungaryIndiaIndonesiaIranIraqIrelandIsraelItalyJamaicaJapanJordanKazakhstanKenyaKoreaKuwaitLaosLatin AmericaLatviaLebanonLiberiaLithuaniaMalaysiaMexicoMicronesiaMiddle AfricaMoldovaMoroccoNepalNetherlandsNicaraguaNigeriaNorth AmericaNorth MacedoniaNorthern AfricaNorthern EuropeNorwayOceaniaPakistanPanamaPeruPhilippinesPolandPortugalRomaniaRussiaSaudi ArabiaScotlandSenegalSerbiaSierra LeoneSingaporeSomaliaSouth AfricaSouth AmericaSouth Central AsiaSouth Eastern AsiaSouthern EuropeSpainSri LankaSt. Vincent and the GrenadinesSudanSwedenSwitzerlandSyriaTaiwanThailandTrinidad and TobagoTurkeyUgandaUkraineUruguayUzbekistanVenezuelaVietnamWest IndiesWestern AfricaWestern AsiaWestern EuropeYemenZaireZimbabweAzores
No Schooling Completed
Income
Poverty
Unemployment
Labor Participation
Family Structure
Vehicle Availability
Education Level
Disability

No Schooling Completed Comparison

Slovenes

Burmese

Exceptional
Excellent
1.4%
NO SCHOOLING COMPLETED
100.0/ 100
METRIC RATING
5th/ 347
METRIC RANK
1.9%
NO SCHOOLING COMPLETED
88.2/ 100
METRIC RATING
136th/ 347
METRIC RANK

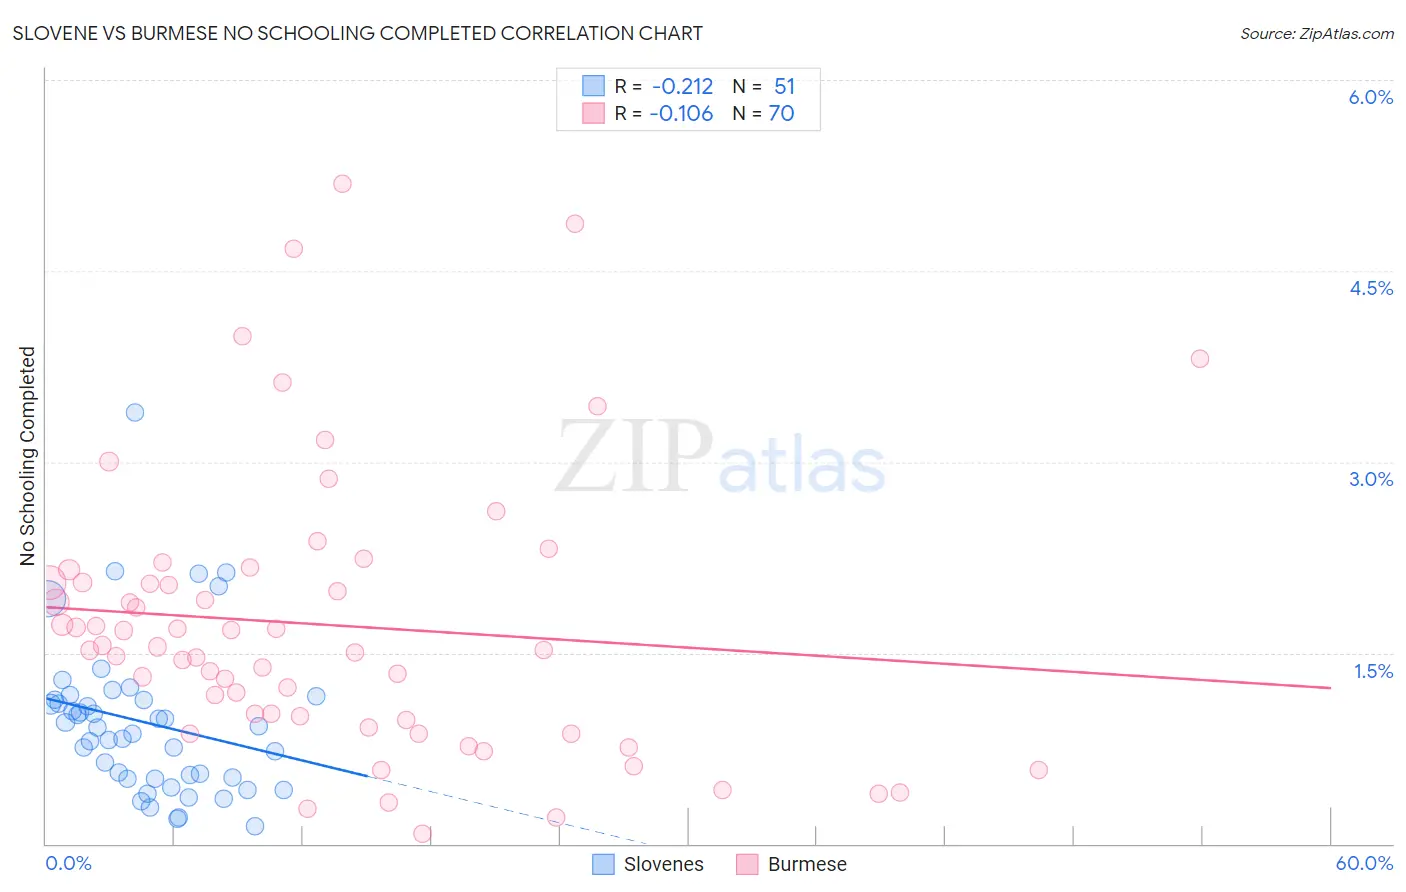
Slovene vs Burmese No Schooling Completed Correlation Chart

The statistical analysis conducted on geographies consisting of 258,600,541 people shows a weak negative correlation between the proportion of Slovenes and percentage of population with no schooling in the United States with a correlation coefficient (R) of -0.212 and weighted average of 1.4%. Similarly, the statistical analysis conducted on geographies consisting of 458,309,119 people shows a poor negative correlation between the proportion of Burmese and percentage of population with no schooling in the United States with a correlation coefficient (R) of -0.106 and weighted average of 1.9%, a difference of 43.2%.
Slovene vs Burmese No Schooling Completed

No Schooling Completed Correlation Summary

MeasurementSloveneBurmese
Minimum0.14%0.081%
Maximum3.4%5.2%
Range3.2%5.1%
Mean0.95%1.7%
Median0.91%1.5%
Interquartile 25% (IQ1)0.51%0.98%
Interquartile 75% (IQ3)1.1%2.1%
Interquartile Range (IQR)0.62%1.1%
Standard Deviation (Sample)0.61%1.1%
Standard Deviation (Population)0.60%1.1%

Similar Demographics by No Schooling Completed

Demographics Similar to Slovenes by No Schooling Completed

In terms of no schooling completed, the demographic groups most similar to Slovenes are German (1.4%, a difference of 0.42%), Carpatho Rusyn (1.4%, a difference of 0.82%), Norwegian (1.3%, a difference of 0.98%), Slovak (1.3%, a difference of 1.4%), and English (1.4%, a difference of 1.8%).
DemographicsRating | RankNo Schooling Completed
Yup'ik
100.0
/100
|
#1
Exceptional
1.2%
Slovaks
100.0
/100
|
#2
Exceptional
1.3%
Norwegians
100.0
/100
|
#3
Exceptional
1.3%
Germans
100.0
/100
|
#4
Exceptional
1.4%
Slovenes
100.0
/100
|
#5
Exceptional
1.4%
Carpatho Rusyns
100.0
/100
|
#6
Exceptional
1.4%
English
100.0
/100
|
#7
Exceptional
1.4%
Swedes
100.0
/100
|
#8
Exceptional
1.4%
Scottish
100.0
/100
|
#9
Exceptional
1.4%
Dutch
100.0
/100
|
#10
Exceptional
1.4%
Lithuanians
100.0
/100
|
#11
Exceptional
1.4%
Irish
100.0
/100
|
#12
Exceptional
1.4%
Poles
100.0
/100
|
#13
Exceptional
1.4%
Scotch-Irish
100.0
/100
|
#14
Exceptional
1.5%
Tlingit-Haida
100.0
/100
|
#15
Exceptional
1.5%

Demographics Similar to Burmese by No Schooling Completed

In terms of no schooling completed, the demographic groups most similar to Burmese are Hmong (1.9%, a difference of 0.090%), Menominee (1.9%, a difference of 0.49%), Immigrants from Turkey (1.9%, a difference of 0.74%), Colville (1.9%, a difference of 0.84%), and Filipino (2.0%, a difference of 0.86%).
DemographicsRating | RankNo Schooling Completed
Seminole
92.0
/100
|
#129
Exceptional
1.9%
Palestinians
91.8
/100
|
#130
Exceptional
1.9%
Immigrants | Hungary
91.6
/100
|
#131
Exceptional
1.9%
Colville
90.4
/100
|
#132
Exceptional
1.9%
Immigrants | Turkey
90.2
/100
|
#133
Exceptional
1.9%
Menominee
89.6
/100
|
#134
Excellent
1.9%
Hmong
88.5
/100
|
#135
Excellent
1.9%
Burmese
88.2
/100
|
#136
Excellent
1.9%
Filipinos
85.5
/100
|
#137
Excellent
2.0%
Immigrants | Israel
85.4
/100
|
#138
Excellent
2.0%
Jordanians
84.5
/100
|
#139
Excellent
2.0%
Marshallese
83.5
/100
|
#140
Excellent
2.0%
Immigrants | Greece
83.5
/100
|
#141
Excellent
2.0%
Venezuelans
81.5
/100
|
#142
Excellent
2.0%
Immigrants | South Central Asia
80.0
/100
|
#143
Good
2.0%