Immigrants from Bulgaria vs Burmese No Schooling Completed
COMPARE
Immigrants from Bulgaria
Burmese
No Schooling Completed
No Schooling Completed Comparison
Immigrants from Bulgaria
Burmese
1.9%
NO SCHOOLING COMPLETED
94.6/ 100
METRIC RATING
120th/ 347
METRIC RANK
1.9%
NO SCHOOLING COMPLETED
88.2/ 100
METRIC RATING
136th/ 347
METRIC RANK
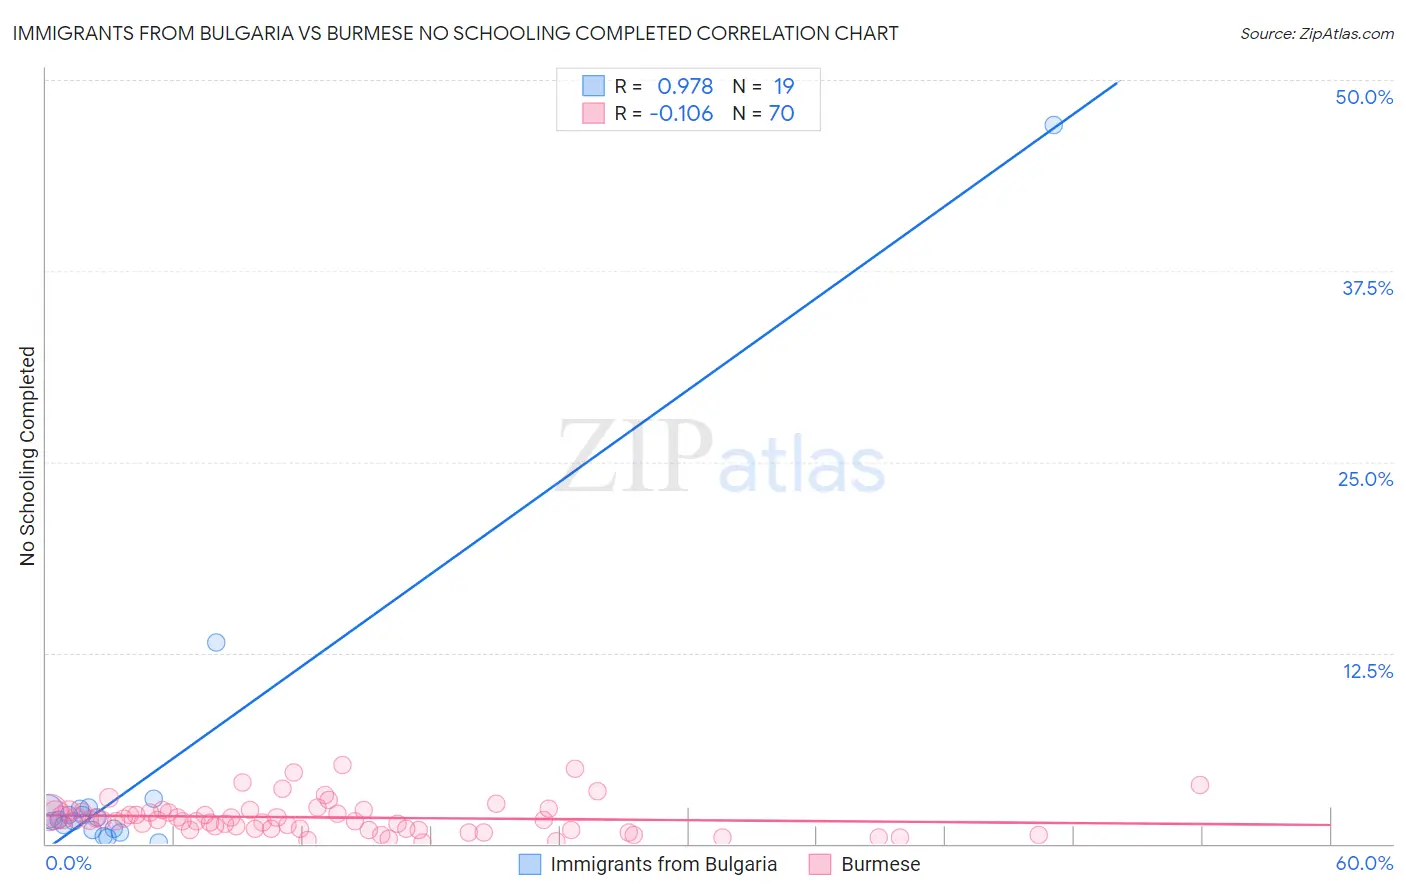
Immigrants from Bulgaria vs Burmese No Schooling Completed Correlation Chart
The statistical analysis conducted on geographies consisting of 171,926,286 people shows a perfect positive correlation between the proportion of Immigrants from Bulgaria and percentage of population with no schooling in the United States with a correlation coefficient (R) of 0.978 and weighted average of 1.9%. Similarly, the statistical analysis conducted on geographies consisting of 458,309,119 people shows a poor negative correlation between the proportion of Burmese and percentage of population with no schooling in the United States with a correlation coefficient (R) of -0.106 and weighted average of 1.9%, a difference of 3.1%.
No Schooling Completed Correlation Summary
| Measurement | Immigrants from Bulgaria | Burmese |
| Minimum | 0.085% | 0.081% |
| Maximum | 47.1% | 5.2% |
| Range | 47.0% | 5.1% |
| Mean | 4.5% | 1.7% |
| Median | 1.5% | 1.5% |
| Interquartile 25% (IQ1) | 0.90% | 0.98% |
| Interquartile 75% (IQ3) | 2.3% | 2.1% |
| Interquartile Range (IQR) | 1.4% | 1.1% |
| Standard Deviation (Sample) | 10.7% | 1.1% |
| Standard Deviation (Population) | 10.4% | 1.1% |
Demographics Similar to Immigrants from Bulgaria and Burmese by No Schooling Completed
In terms of no schooling completed, the demographic groups most similar to Immigrants from Bulgaria are Immigrants from Croatia (1.9%, a difference of 0.060%), Cree (1.9%, a difference of 0.090%), Iroquois (1.9%, a difference of 0.40%), Immigrants from Kuwait (1.9%, a difference of 0.46%), and Cambodian (1.9%, a difference of 0.53%). Similarly, the demographic groups most similar to Burmese are Hmong (1.9%, a difference of 0.090%), Menominee (1.9%, a difference of 0.49%), Immigrants from Turkey (1.9%, a difference of 0.74%), Colville (1.9%, a difference of 0.84%), and Filipino (2.0%, a difference of 0.86%).
| Demographics | Rating | Rank | No Schooling Completed |
| Spanish | 95.5 /100 | #118 | Exceptional 1.9% |
| Iroquois | 95.1 /100 | #119 | Exceptional 1.9% |
| Immigrants | Bulgaria | 94.6 /100 | #120 | Exceptional 1.9% |
| Immigrants | Croatia | 94.5 /100 | #121 | Exceptional 1.9% |
| Cree | 94.5 /100 | #122 | Exceptional 1.9% |
| Immigrants | Kuwait | 93.9 /100 | #123 | Exceptional 1.9% |
| Cambodians | 93.8 /100 | #124 | Exceptional 1.9% |
| Immigrants | Europe | 93.7 /100 | #125 | Exceptional 1.9% |
| Immigrants | Romania | 92.6 /100 | #126 | Exceptional 1.9% |
| Israelis | 92.4 /100 | #127 | Exceptional 1.9% |
| Spaniards | 92.3 /100 | #128 | Exceptional 1.9% |
| Seminole | 92.0 /100 | #129 | Exceptional 1.9% |
| Palestinians | 91.8 /100 | #130 | Exceptional 1.9% |
| Immigrants | Hungary | 91.6 /100 | #131 | Exceptional 1.9% |
| Colville | 90.4 /100 | #132 | Exceptional 1.9% |
| Immigrants | Turkey | 90.2 /100 | #133 | Exceptional 1.9% |
| Menominee | 89.6 /100 | #134 | Excellent 1.9% |
| Hmong | 88.5 /100 | #135 | Excellent 1.9% |
| Burmese | 88.2 /100 | #136 | Excellent 1.9% |
| Filipinos | 85.5 /100 | #137 | Excellent 2.0% |
| Immigrants | Israel | 85.4 /100 | #138 | Excellent 2.0% |